

Economic Report of the President 1994 - The American Presidency ...
Economic Report of the President 1994 - The American Presidency ...
Economic Report of the President 1994 - The American Presidency ...

You also want an ePaper? Increase the reach of your titles
YUMPU automatically turns print PDFs into web optimized ePapers that Google loves.
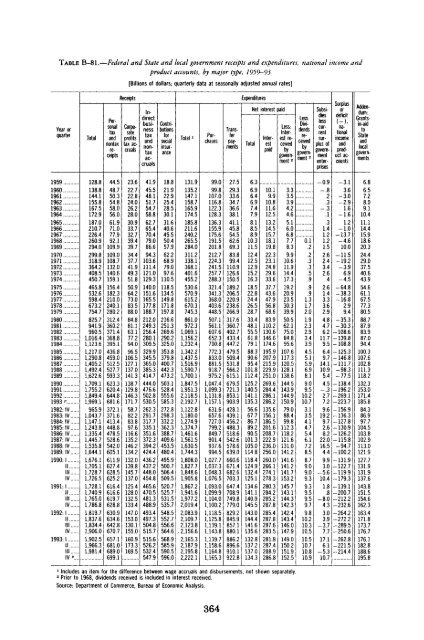
TABLE B-81.—Federal and State and local government receipts and expenditures, national income andproduct accounts, by major type, 1959-93[Billions <strong>of</strong> dollars; quarterly data at seasonally adjusted annual rates]Year orquarter19591960196119621963196419651966196719681969197019711972197319741975197619771978197919801981198219831984198519861987198819891990199119921993 >>1982: IV1983: IV1984: IV1985: IV1986: IV1987: IV1988: IV1989: IV1990:1IIIllIV1991:1IIIllIV1992:1IIIllIV1993:1IIIllIV "....ReceiptsTotal128.8138.8144.1155.8167.5172.9187.0210.7226.4260.9294.0299.8318.9364.2408.5450.7465.8532.6598.4673.2754.7825.7941.9960.51,016.41,123.61,217.01,290.81,405.21,492.41,622.61,709.11,755.21,849.41,969.1965.91,043.71,147.11,243.81,335.41,445.71,535.81,644.11,676.11,705.11.728.71,726.51,728.11,740.91,765.01,786.81.819.71,837.61,834.41,906.01,902.51,966.31,981.4Parpersonaltaxandnontaxreceipts44.548.750.354.858.056.061.971.077.992.1109.9109.0108.7132.0140.6159.1156.4182.3210.0240.1280.2312.4360.2371.4368.8395.1436.8459.0512.5527.7593.3623.3620.4644.8681.6372.1371.6413.4448.8478.5528.6542.0605.1611.9627.4628.5625.2616.4616.6619.7628.8630.9634.6642.8670.7657.1681.0689.0699.1Corporatepr<strong>of</strong>itstax accruals23.622.722.824.026.228.030.933.732.739.439.734.437.741.949.351.850.964.273.083.588.084.881.163.177.294.096.5106.5127.1137.0141.3138.7129.8146.3171.758.782.283.897.6116.6135.2146.2134.2132.0139.8145.7137.0125.4128.0132.5133.4147.0153.0130.1155.0160.9173.3169.5Indirectbusinesstaxandnontaxaccruals41.945.548.151.754.758.862.765.470.479.086.694.3103.6111.4121.0129.3140.0151.6165.5177.8188.7212.0249.3256.4280.1309.5329.9345.5365.0385.3414.7444.0476.6502.8530 5262.3291.7317.7335.1351.6372.3394.2424.4436.2437.2448.0454.8465.6470.5481.3488.9493.4497.3504.8515.7515.6526.2532.4547.9Contributionsforsocialinsurance18.821.922.925.428.530.131.640.645.550.457.962.268.979.097.6110.5118.5134.5149.8171.8197.8216.6251.3269.6290.2325.0353.8379.8400.7442.3473.2503.1528.4555.6585.3272.8298.3332.2362.3388.7409.6453.5480.4495.9500.7506.4509.5520.7525.7531.5535.7548.5552.7556.6564.6568.9585.9590.5596.0ExpendituresTotal»131.9135.2147.1158.7165.9174.5185.8211.6240.2265.5284.0311.2338.1368.1401.6455.2530.6570.9615.2670.3745.3861.0972.31,069.11,156.21,232.41,342.21,437.51,516.91,590.71,700.11,847.51,951.32,118.52,192.71,122.81,180.01,274.91,374.71,461.61,561.51,630.51,744.31,808.01,827.71,848.61,905.81,867.21,941.61,977.22,019.42,083.92,109.72,123.8.2,156.62,165.32,187.92,195.82,222.1Purchases99.099.8107.0116.8122.3128.3136.3155.9175.6191.5201.8212.7224.3241.5257.7288.3321.4341.3368.0403.6448.5507.1561.1607.6652.3700.8772.3833.0881.5918.7975.21,047.41,099.31,131.81,157.1631.6657.6727.0799.2849.7901.4937.6994.51,027.71,037.31,048.31,076.51,093.01,099.91,104.01,100.21,118.51,125.81,139.11,143.81,139.71,158.61,164.81,165.3Transferpayments27.529.333.634.736.638.141.145.854.562.669.383.899.4110.9126.6150.5189.2206.5220.9238.6266.9317.6360.7402.7433.4447.2479.5509.4531.8566.2615.1679.5721.3853.1903.9428.1439.1456.2488.3518.6542.6578.6639.0660.6671.4682.6703.3647.4708.9749.8779.0829.2845.9857.1880.1886.2896.6910.1922.8Net interest paidTotal6.36.96.46.97.47.98.18.58.910.311.512.412.512.915.216.318.522.824.426.528.733.448.155.561.879.188.390.695.4101.8112.4125.2140.5141.1135.356.667.786.789.290.5101.3105.0114.8118.4124.9132.4125.1134.6141.1140.9145.5143.0144.4141.6135.6132.8137.2137.0134.3Interestpaid10.19.910.811.612.513.214.515.718.119.822.323.124.829.633.637.743.647.956.868.683.9110.2130.6146.6174.6195.9207.9215.9229.9251.0269.6284.4286.1286.2135.6156.1186.5201.6208.7222.9236.0256.0260.0266.1274.1278.3280.3284.2285.2287.8285.4287.8287.6283.5281.8287.4288.9286.8Less:Interestreceivedbygovernment23.33.53.94.24.65.16.06.87.78.39.910.611.914.417.319.220.923.530.339.950.562.175.084.895.6107.6117.3120.5128.1138.6144.5143.9144.9150.979.088.499.8112.3118.2121.6131.0141.2141.6141.2141.7153.2145.7143.1144.3142.3142.4143.4146.0147.9149.0150.2151.9152.5Less:Dividendsreceivedbygovernment2b'i*.2.2.3.3.5.9.9.91.31.72.01.92.32.93.43.94.55.15.96.98.19.09.510.21073.13.54.14.75.46.17.28.58.79.09.09.39.39.59.59.79.810.210.310.510.510.710.810.9Subsi-Hiocoieslocclesscurrentsurplus<strong>of</strong>governmententerprises-0.9-.8.2.3-.3.1.31.41.21.21.52.62.43.42.6.42.61.43.33.62.94.84.76.211.79.56.49.714.110.95.44.5-.32.77.29.619.29.72.68.222.016.54.49.93.0-5.610.41.8.8-8.04.33.03.9-3.77.717.16.1-5.310.7SurplusorH<strong>of</strong>iritOcllCIl( —)>nationalincomeandproductaccounts-3.13.6-3.0-2.91.6-1.61.2-1.0-13.7-4.610.0-11.5-19.2-3.96.9-4.5-64.8-38.3-16.82.99.4-35.3-30.3-108.6-139.8-108.8-125.3-146.8-111.7-98.3-77.5-138.4-196.2-269.1-223.7-156.9-136.3-127.8-130.9-126.2-115.8-94.7-100.2-131.9-122.7-119,9-179.3-139.1-200.7-212.2-232.6-264.2-272.2-289.5-250.6-262.8-221.5-214.4Addendum:Grantsin-aidtoStateandlocalgovernments6.86.57.28.09.110.411.114.415.918.620.324.429.03*7.540.643.954.661.167.577.380.588.787.983.987.094.4100.3107.6102.8111.3118.2132.3153.0171.4185.884.386.997.7104.5103.8102.9113.0121.9127.7131.9131.9137.6143.8151.5154.6162.3163.4171.8173.7176.7176.1182.8188.6195.81Includes an item for <strong>the</strong> difference between wage accruals and disbursements, not shown separately.2Prior to 1968, dividends received is included in interest received.Source: Department <strong>of</strong> Commerce, Bureau <strong>of</strong> <strong>Economic</strong> Analysis.364


