TABLE B-70.—Aggregate reserves <strong>of</strong> depository institutions and monetary base, 1939-93[Averages <strong>of</strong> daily figures l ; millions <strong>of</strong> dollars; seasonally adjusted, except as noted]Adjusted for changes in reserve requirements 2Reserves <strong>of</strong> depository institutionsBorrowings <strong>of</strong> depositoryinstitutions from <strong>the</strong> FederalReserve, NSAYear and monthTotalNonborrowedNonborrowedplusextendedcreditRequiredMonetarybaseTotalSeasonalExtendedcreditDecember:195911,10910,16810,16810,60340,8809411960196119621963196411,24711,49911,60411,73012,01111,17211,36611,34411,39711,74711,17211,36611,34411,39711,74710,50310,91511,03311,23911,60540,97741,85342,95745,00347,161741332603322641965....1966....1967....1968....1969....12,31612,22313,18013,76714,16811,87211,69012,95213,02113,04911,87211,69012,95213,02113,04911,89211,88412,80513,34113,88249,62051,56554,57958,35761,5694445322287461,1191970197119721973197414,55815,23016,64517,02117,55014,22515,10415,59515,72316,82314,22515,10415,59515,72316,97014,30915,04916,36116,71717,29265,01369,10875,16781,07387,5353321261,0501,298727413214719751976197719781979198019811982198319841985198619871988198919901991199219931992: JanFebMarAprMayJune17,82218,38818,99019,75320,72022,01522,44323,60025,36726,84531,44838,94338,86240,39840,49241,76745,53354,35160,53646,22747,79548,50948,99249,49649,31617,69218,33518,42018,88519,24820,32521,80722,96624,59323,65930,12938,11638,08538,68340,22741,44145,34154,22860,45445,99447,71748,41848,90249,34149,08717,70418,33518,42018,88519,24820,32821,95623,15224,59526,26330,62838,41938,56839,92740,24741,46445,34254,22860,45445,99547,71948,42048,90449,34149,08717,55618,11518,80019,52120,27921,50122,12423,10024,80625,99030,41137,57337,81639,35139,57040,10244,55553,19659,47445,22446,73047,48147,85548,49548,40393,887101,515110,323120,445131,143142,004149,021160,127175,467187,237203,585223,667239,872256,932267,734293,185317,169350,798386,072319,385322,849324,655326,691328,863330,228130535698681,4731,6906366347743,1861,3188277771,716265326192124822337791901552291413551358211654339611356389313076381831172232479814912314818622,6044993034831,2442023110122200JulyAugSeptOctNovDec1993: JanFebMarAprMayJune49,62950,34151,27452,83653,81554,35154,66554,92255,16655,19756,87757,11949,34550,09150,98752,69353,71154,22854,50054,87655,07455,12456,75656,93849,34550,09150,98752,69353,71154,22854,50154,87755,07455,12456,75656,93848,66449,40750,28051,76352,77253,19653,40553,81853,95354,10155,88156,209333,177336,844341,585344,849347,832350,798353,224355,734358,374360,634364,769368,06928425128714310412416545917312118120322319311440181118264184142000001100000JulyAugSeptOctNovDec57,56758,03358,83759,81960,45960,53657,32357,68058,41059,53460,37060,45457,32357,68058,41059,53460,37060,45456,47857,08057,74758,73059,35959,474370,978374,532379,261381,765384,580386,072244352428285898221023423619275310000001 Data are prorated averages <strong>of</strong> biweekly (maintenance period) averages <strong>of</strong> daily figures.2 Aggregate reserves incorporate adjustments for discontinuities associated with regulatory changes to reserve requirements. Fordetails on aggregate reserves series see Federal Reserve Bulletin.Note.—NSA indicates data are not seasonally adjusted.Monetary base data do not reflect revisions released on February 3, <strong>1994</strong>.Source: Board <strong>of</strong> Governors <strong>of</strong> <strong>the</strong> Federal Reserve System.350
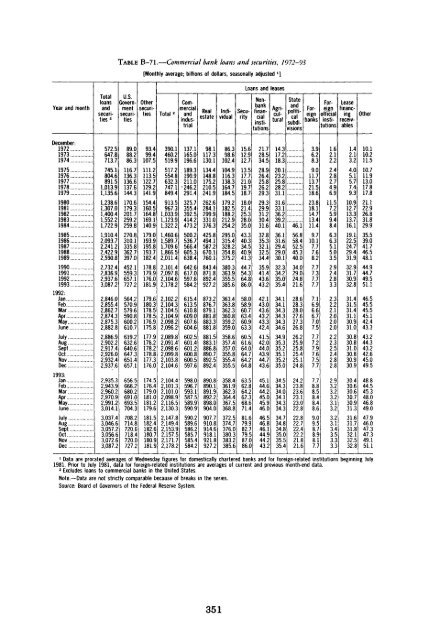
TABLE B-71.—Commercial bank loans and securities, 1972-93[Monthly average; billions <strong>of</strong> dollars, seasonally adjusted ']Year and monthTotalloansandsecurities2U.S.Govern-O<strong>the</strong>rTotal 2RealestateLoans and leasessecuri-tiesCommercialandindustrialIndividualSecurityNonbankfinancialinstitutionsAgriculturalStateandpoliticalsubdivisionsForeignbanksForeign<strong>of</strong>ficialinstitutionsLeasefinancing.O<strong>the</strong>rreceivablesDecember:1972...1973...1974...1975...1976...1977...1978...1979....1980....1981....1982....1983....1984...1985....1986...1987...1988...1989...1990...1991....1992...1993...1992:JanFebMarAprMayJune....JulyAugSept....OctNovDec1993:JanFebMarJuneJulyAugSeptOctNovDec572.5647.8713.7745.1804.6891.51,013.91,135.61,238.61,307.01,400.41,552.21,722.91,910.42,093.72,241.22,422.92,590.82,732.42,836.92,937.63,087.22,846.02,855.42,862.72,874.32,875.32,882.82,886.92,902.22,917.42,926.02,932.42,937.62,935.32,943.92,960.22,970.92,991.23,014.13,037.43,046.63,057"3,056.63,072.63,087.289.088.286.3116.7136.3136.6137.6144.3170.6179.3201.7259.2259.8270.8310.1335.8362.7397.0452.1559.3657.1727.2564.2570.9579.6590.8600.2610.7619.2632.6640.6647.3651.4657.1656.5666.2680.2691.0693.5704.3708.2714.8720.6718.4720.0727.293.499.4107.5111.2113.5122.7129.2141.9154.4160.5164.8169.1140.9179.0193.9195.8193.7182.4178.8179.9176.0181.9179.6180.3178.5178.5176.9175.8177.9178.2178.2178.8177.3176.0174.5176.4179.0181.0181.2179.6181.5182.4182.6180.7180.9181.9390.1460.2519.9517.2554.8632.3747.1849.4913.5967.31,033.91,123.91,322.21,460.61,589.71,709.61,866.52,011.42,101.42,097.82,104.62,178.22,102.22,104.32.104.52,104.92,098.22,096.22,089.82,091.42,098.62,099.82,103.82,104.62,104.42,101.32,101.02,098.92,116."2,130.32,147.82,149.42,153.92,157.52,171.72,178.2137.1165.0196.6189.3190.9211.0•246.2291.4325.7355.4392.5414.2473.2500.2536.7566.4605.3638.4642.6617.0597.6584.2615.4613.5610.8609.0607.6604.6602.5601.4601.2600.8600.5597.6598.0596.7593.1587.5589.9590.9590.2589.6586.2585.7585.4584.298.1117.3130.1134.4148.8175.2210.5241.9262.6284.1299.9331.0376.3425.8494.1587.2670.1760.1843.4871.8892.4927.2873.2876.7879.1881.8883.3881.8881.5883.1886.8890.7892.5892.4890.8890.1891.9892.2898.0904.0907.7910.8914.6918.1921.8927.286.398.6102.4104.9116.3138.3164.7184.5179.2182.5188.2212.9254.2295.0315.4328.2354.8375.2380.3363.9355.5385.6363.4363.8362.3360.8359.2359.0358.6357.4357.0355.8355.4355.5358.4361.9362.3364.4367.5368.8372.5374.7376.0380.3383.2385.615.612.912.713.517.721.019.718.718.021.425.328.035.043.340.334.540.941.344.754.364.886.058.058.960.763.460.963.360.561.664.064.764.264.863.562.864.262.368.671.481.679.982.779.587.086.021.728.534.528.926.425.826.229.329.329.931.230.431.632.835.332.132.534.435.941.443.643.242.143.043.643.243.342.441.542.044.043.944.743.645.144.644.245.045.946.046.546.846.144.944.243.214.317.218.320.123.225.828.231.131.633.136.239.240.136.131.629.429.030.132.334.235.035.434.134.134.334.334.334.634.935.335.235.135.235.034.534.334.034.134.334.334.734.834.835.035.535.446.156.858.452.545.340.034.029.024.821.628.628.328.027.627.326.826.225.925.825.425.124.824.223.823.623.123.022.822.822.722.422.221.821.63.96.28.39.011.713.721.518.623.818.114.713.411.49.710.17.77.68.27.77.37.77.71.62.12.22.42.82.74.96.911.57.25.99.48.46.36.35.15.03.52.92.42.83.32.32.22.12.02.02.02.22.32.52.42.82.82.93.23.23.23.13.23.23.13.43.3.33.31.42.13.24.05.15.77.49.310.912.713.313.716.119.122.524.729.431.932.931.730.932.831.431.531.431.130.931.030.830.831.030.830.930.930.430.630.630.730.931.331.631.731.832.132.532.810.110.211.510.711.913.017.817.821.122.926.831.829.935.539.041.746.548.144.944.749.551.146.545.545.545.142.443.343.244.343.242.645.049.548.844.545.348.046.849.047.946.047.347.349.151.11 Data are prorated averages <strong>of</strong> Wednesday figures for domestically chartered banks and for foreign-related institutions beginning July1981. Prior to July 1981, data for foreign-related institutions are averages <strong>of</strong> current and previous month-end data.2 Excludes loans to commercial banks in <strong>the</strong> United States.Note.—Data are not strictly comparable because <strong>of</strong> breaks in <strong>the</strong> series.Source.- Board <strong>of</strong> Governors <strong>of</strong> <strong>the</strong> Federal Reserve System.351
- Page 1:
S : Sf:' ;: W^W't-^WW': ;, S 4 Si :
- Page 5:
unitedminds
- Page 9 and 10:
Economic Report of the PresidentTo
- Page 11:
the Technology Reinvestment Project
- Page 14:
formed health care system, increase
- Page 19 and 20:
CONTENTSPageCHAPTER 1. A STRATEGY F
- Page 21:
PageProviding Comprehensive Benefit
- Page 24 and 25:
LIST OF CHARTS—CONTINUEDPage3-5 L
- Page 27 and 28:
CHAPTER 1A Strategy for Growth and
- Page 29 and 30:
which have left consumers and busin
- Page 31 and 32:
that growth in both real compensati
- Page 33 and 34:
for inflation was on average roughl
- Page 35 and 36:
Box 1-2.—Saving, Investment, and
- Page 37 and 38:
investments in human capital; inves
- Page 39 and 40:
of the income distribution (Table 1
- Page 41 and 42:
Box 1-3.—Credible Deficit Reducti
- Page 43 and 44:
Chart 1-7 Correlation of Investment
- Page 45 and 46:
Box 1~4*~-A Balanced Budget Amendme
- Page 47 and 48:
This educational record is not good
- Page 49 and 50:
fallen markedly since the 1960s (Ch
- Page 51 and 52:
The development and deployment of n
- Page 53 and 54:
Earlier rounds of GATT talks had fo
- Page 55 and 56:
Chart 1-10 Projected Real Growth Ra
- Page 57 and 58:
are therefore on the public dole. M
- Page 59:
prise communities and be granted sm
- Page 62 and 63:
ingredient that should allow the ec
- Page 64 and 65:
Chart 2-2 National Defense Purchase
- Page 66 and 67:
Chart 2-3 Growth of U.S. Merchandis
- Page 68 and 69:
Chart 2-5 Households: Credit Market
- Page 70 and 71:
THE HEADWINDS ARE MOSTLY CALMINGAs
- Page 72 and 73:
1993, real consumer spending increa
- Page 74 and 75:
RESIDENTIAL INVESTMENTResidential i
- Page 76 and 77:
smallest annual increase in 20 year
- Page 78 and 79:
ments with the Internal Revenue Ser
- Page 80 and 81:
safe-harbor rules for underpayment
- Page 82 and 83:
Chart 2-9 Alternative Measures of t
- Page 84 and 85:
Meanwhile, the Mountain States were
- Page 86 and 87:
inflation is measured by the Blue C
- Page 88 and 89:
Saving, Investment, and Capital Acc
- Page 90 and 91:
the future should be reflected in l
- Page 92 and 93:
Chart 2-15 Dynamic Effects of Defic
- Page 94 and 95:
joyed healthy average real GDP grow
- Page 96 and 97:
Chart 2-16 Personal Income Taxes as
- Page 98 and 99:
TABLE 2-2.— Administration Foreca
- Page 100 and 101:
TABLE 2-3.— Accounting for Growth
- Page 103 and 104:
CHAPTER 3Trends and Recent Developm
- Page 105 and 106:
first quarter of 1991, nonfarm payr
- Page 107 and 108:
cause defense cutbacks have caused
- Page 109 and 110:
UNEMPLOYMENT AND NONEMPLOYMENTThe U
- Page 111 and 112:
Chart 3-3 Civilian Unemployment Rat
- Page 113 and 114:
Chart 3-6 Employment-to-Population
- Page 115 and 116:
Chart 3-8 Ratio of White-Collar to
- Page 117 and 118:
than would be expected given its hi
- Page 119 and 120:
that the natural rate is falling? M
- Page 121 and 122:
SLOW INCOME GROWTHIncome trends hav
- Page 123 and 124:
Chart 3-10 Average Annual Growth of
- Page 125 and 126:
Box 3-3.—Consequences of Producti
- Page 127 and 128:
likely that immigration could expla
- Page 129 and 130:
We do, however, know how many worke
- Page 131 and 132:
size. No data are available on vola
- Page 133 and 134:
BENEFITSOne of the concerns raised
- Page 135 and 136:
edented partnership to develop a nu
- Page 137 and 138:
CHAPTER 4Health Care ReformTHE UNIT
- Page 139 and 140:
make cost-conscious decisions. In a
- Page 141 and 142:
A third rationale for universal cov
- Page 143 and 144:
Box 4-1.—Moral Hazard and Adverse
- Page 145 and 146:
ies depending on one's health statu
- Page 147 and 148:
than people in other countries do,
- Page 149 and 150:
sumers are ill equipped to bring st
- Page 151 and 152:
By itself, the aging of the populat
- Page 153 and 154:
TABLE 4-3.- Sources and Uses of Hea
- Page 155 and 156:
about 65 to 70 cents for a typical
- Page 157 and 158:
THE ARCHITECTURE OF THE HEALTHSECUR
- Page 159 and 160:
etary savings for the Federal Gover
- Page 161 and 162:
contribution, within limits. Outsid
- Page 163 and 164:
salary income, payments from the em
- Page 165 and 166:
TABLE 4-6.—Caps on Premiums by Fi
- Page 167 and 168:
An example will illustrate the proc
- Page 169 and 170:
TABLE 4-9.—Sources and Uses of Fe
- Page 171 and 172:
Chart 4-9 Business Spending on Heal
- Page 173:
Health care reform should set the s
- Page 176 and 177:
and private sectors, addressing env
- Page 178 and 179:
Box 5-1.—Selected National Perfor
- Page 180 and 181:
Box 5-2*—Market PowerFirms are sa
- Page 182 and 183:
ate regulation. For example, State
- Page 184 and 185:
competitiveness of U.S. industry, a
- Page 186 and 187:
Box 5-4.—ExternalitiesAn external
- Page 188 and 189:
in the habitat of the spotted owl r
- Page 190 and 191:
CLIMATE CHANGE ACTION PLANCertain g
- Page 192 and 193:
eral, lays a foundation for broader
- Page 194 and 195:
The Administration's proposal seeks
- Page 196 and 197:
vances in technical know-how have a
- Page 198 and 199:
Investments in R&D are risky. Like
- Page 200 and 201:
1950s and 1960s, and American compa
- Page 202 and 203:
ico and Lawrence Livermore in Calif
- Page 204 and 205:
of industry. MOCs will be affiliate
- Page 206 and 207:
tiveness. Again, the hoped-for resu
- Page 208 and 209:
forts to cut the massive Federal bu
- Page 210 and 211:
TECHNOLOGY POLICY, GROWTH, ANDCOMPE
- Page 212 and 213:
mitment to an open international tr
- Page 214 and 215:
ses, which take such intersectoral
- Page 216 and 217:
An important sectoral development i
- Page 218 and 219:
TABLE 6-3.—Stock of U.S. Outward
- Page 220 and 221:
technical change has been offered a
- Page 222 and 223:
ent account is a broader measure of
- Page 224 and 225:
TABLE 6-6.—Intrafirm Trade as Sha
- Page 226 and 227:
greater access to the Japanese mark
- Page 228 and 229:
the transparency of its trade regim
- Page 230 and 231:
that if the states of the former So
- Page 232 and 233:
Box 6-3.—Mexican Economic Reforms
- Page 234 and 235:
1998, while nontariff barriers on a
- Page 236 and 237:
ward convergence in environmental a
- Page 238 and 239:
Box 6-4.—The Asian "Miracle"Per c
- Page 240 and 241:
Box 6-5.—The Economic Impact of t
- Page 242 and 243:
development, and environmental clea
- Page 244 and 245:
THE TRADE POLICY AGENDABy lowering
- Page 246 and 247:
ignated monopolies. It also establi
- Page 248 and 249:
The dollar ended 1993 roughly where
- Page 250 and 251:
Box 6-7.—Exchange-Rate Volatility
- Page 252 and 253:
Chart 6-5 French Franc-Deutsche Mar
- Page 254 and 255:
Besides bringing these endeavors to
- Page 257 and 258:
LETTER OF TRANSMITTALCOUNCIL OF ECO
- Page 259 and 260:
Report to the President on the Acti
- Page 261 and 262:
duction budget package, the North A
- Page 263 and 264:
Working Group studying cost-benefit
- Page 265 and 266:
prepares the Economic Indicators an
- Page 267:
Appendix BSTATISTICAL TABLES RELATI
- Page 270 and 271:
POPULATION, EMPLOYMENT, WAGES, AND
- Page 272 and 273:
AGRICULTURE:PageB-96. Farm income,
- Page 274 and 275:
NATIONAL INCOME OR EXPENDITURETABLE
- Page 276 and 277:
TABLE B-2.—Gross domestic product
- Page 278 and 279:
TABLE B-3.—Implicit price deflato
- Page 280 and 281:
TABLE B-4.—Fixed-weighted price i
- Page 282 and 283:
TABLE B-5.—Changes in gross domes
- Page 284 and 285:
TABLE B-7.—Cross domestic product
- Page 286 and 287:
TABLE B-9.—Gross domestic product
- Page 288 and 289:
TABLE B-ll.—Gross domestic produc
- Page 290 and 291:
TABLE B-13.—Gross domestic produc
- Page 292 and 293:
TABLE B-15.—Personal consumption
- Page 294 and 295:
TABLE B-17.—Gross and net private
- Page 296 and 297:
TABLE B-19.—Inventories and final
- Page 298 and 299:
TABLE B-21.—Foreign transactions
- Page 300 and 301:
TABLE B-23.—Relation of gross dom
- Page 302 and 303:
TABLE B-25.—National income by ty
- Page 304 and 305:
TABLE B-26.—Sources of personal i
- Page 306 and 307: TABLE B-27.—Disposition of person
- Page 308 and 309: TABLE B-29.—Gross sating and inve
- Page 310 and 311: TABLE B-31.—Median money income (
- Page 312 and 313: TABLE B-33.—Population and the la
- Page 314 and 315: TABLE B-34.—Civilian employment a
- Page 316 and 317: TABLE B-36.—Unemployment by demog
- Page 318 and 319: TABLE B-38.—Civilian labor force
- Page 320 and 321: TABLE B-40.—Civilian unemployment
- Page 322 and 323: TABLE B-42.—Unemployment by durat
- Page 324 and 325: TABLE B-44.—Employees on nonagric
- Page 326 and 327: TABLE B-45.—Hours and earnings in
- Page 328 and 329: TABLE B-47.—Productivity and rela
- Page 330 and 331: PRODUCTION AND BUSINESS ACTIVITYTAB
- Page 332 and 333: TABLE B-51.—Industrial production
- Page 334 and 335: TABLE B-53.—New construction acti
- Page 336 and 337: TABLE B-54.—New housing units sta
- Page 338 and 339: Year or monthTABLE B-56.—Manufact
- Page 340 and 341: TABLE B-58.—Manufacturers' new an
- Page 342 and 343: TABLE B-60.—Consumer price indexe
- Page 344 and 345: TABLE B-61.—Consumer price indexe
- Page 346 and 347: TABLE B-63.—Changes in consumer p
- Page 348 and 349: TABLE B-64.—Producer price indexe
- Page 350 and 351: TABLE B-66.—Producer price indexe
- Page 352 and 353: TABLE B-67.—Changes in producer p
- Page 354 and 355: TABLE B-69.—Components of money s
- Page 358 and 359: TABLE B-72.—Bond yields and inter
- Page 360 and 361: TABLE B-73.—Total funds raised in
- Page 362 and 363: TABLE B-74.—Mortgage debt outstan
- Page 364 and 365: TABLE B-76.—Consumer credit outst
- Page 366 and 367: TABLE B-78.—Federal receipts, out
- Page 368 and 369: TABLE B-79.—Federal budget receip
- Page 370 and 371: TABLE B-81.—Federal and State and
- Page 372 and 373: TABLE B-83.—State and local gover
- Page 374 and 375: TABLE B-85.—Interest-bearing publ
- Page 376 and 377: TABLE B-87.—Estimated ownership o
- Page 378 and 379: TABLE B-89.—Corporate profits by
- Page 380 and 381: TABLE B-91.—Sales, profits, and s
- Page 382 and 383: TABLE B-93.—Sources and uses of f
- Page 384 and 385: TABLE B-95.—Business formation an
- Page 386 and 387: 19481949195019511952195319541955195
- Page 388 and 389: TABLE B-99.—Indexes of prices rec
- Page 390 and 391: TABLE B-101.— Farm business balan
- Page 392 and 393: TABLE B-103.—U.S. international t
- Page 394 and 395: TABLE B-104.—U.S. merchandise exp
- Page 396 and 397: TABLE B-106.—U.S. merchandise exp
- Page 398 and 399: TABLE B-108.—Industrial productio
- Page 400 and 401: TABLE B-110.—Foreign exchange rat
- Page 402 and 403: NATIONAL WEALTHTABLE B-l 12.—Nati
- Page 404: SUPPLEMENTARY TABLETABLE B-114.—S