TABLE B-13.—Gross domestic product <strong>of</strong> nonfinancial corporate business, 1959-93[Billions <strong>of</strong> dollars; quarterly data at seasonally adjusted annual rates]Year orquarterTotalGrossdomesticCon-product sump-tion <strong>of</strong>nonfinancialfixed<strong>of</strong>corporatitalcap-businessIndirectbusinesstaxes*TotalTotalNet domestic productDomestic incomeCorporate pr<strong>of</strong>its with inventory valuation and capitalconsumption adjustmentsPr<strong>of</strong>itsbeforetaxPr<strong>of</strong>itstaxliabilityPr<strong>of</strong>itsTotalPr<strong>of</strong>its after taxCompensation<strong>of</strong>employeesDividendsUndistributedpr<strong>of</strong>itsInventoryvaluationadjustmentCapitalconsumptionadjustmentNetinterest1959196019611962196319641965 .196619671968196919701971197219731974197519761977197819791980198119821983,1984198519861987198819891990199119921993 "1982: IV1983: IV1984: IV1985: IV1986: IV1987: IV1988: IV1989: IV1990: IIIillIV1991: IIIIllIV1992: IIIIllIV1993: IIIIllIV P267.5278.1285.5311.7331.8358.1393.5431.0453.4500 5543.35614606.4673 3754.5814.6881.2994.61124.71,279.41,423.71,546.51,748.61802 81,936.12,166.52,293.62 386 32!547.32 764 82,913.53,045.53 082.13,243.41,806.32,037.22,228.22,338.82,422.82,627.62,843.22,951.53,007.73,064.13,057.83,052.53,048.b3,063.43,086.83,129.53,159.83,218.13,264.23,331.63,331.73,395.93,432.224.225.226.026.928.129.531534.337.541445.349 754.661066.277.593.3103.8116.2132.3153.0174.8207.0229 4242.1248.1258.02714281.4297 5317.4329.33415352 7362.3238.8261.5258.9263.4275.8286.1304.5326.5322.6326.6332.0336.1339.4340.4342.3343.9345.1347.8366.1351.7356.8359.0367.0366.3243.2252.9259.6284.8303.7328.6362 0396.7415.94591498.05116551.7612 4688.3737.1788.0890.81,008.51,147.21,270.71,371.71,541.51573 41,694.01,918.32,035.52 114 92,265.92 467 32,596.22,716.22 740 62,890.71,567.51,775.71,969.42,075.42,147.12,341.42,538.82,625.02,685.12,737.52,725.82,716.42,709.22,722.92,744.52,785.62,814.62,870.32,898.22,979.92,975.03,036.83,065.126.028.329.532.034.036.639.240.543.149 754.758 864.569 276.381.487.495.1104.1114.6123.3139.4167.9169 4185.8206.9220.32314241.02571274.2290.43115327 7345.5172.6194.0212.4223 8233.6245.4263.1279.0285.3285.8294.0296.6304.2307.1315.3319.5321.8323.9329.1336.0333.0344.0347.0357.9217.2224.6230.1252.8269.7292.0322.8356.2372.8409 3443.3452 84873543 2612.0655.7700.6795.7904.41,032.61,147.41,232.41,373.61404 01,508.21,711.41,815.31883 62,024.92 210 22,322.02,425.82,429.02,563.11,394.91,581.71,756.91,851.61,913.52,096.02,275.72,346.02,399.82,451.72,431.82,419.82,405.02,415.82,429.22,466.12,492.92,546.42,569.02,643.92,642.02,692.82,718.1171.5181.2185.3200.1211.1226.7246.5274.0292.3323 2358.8378 7402.0447 1505.9556.8580.3656.7741.8850.2964.21,053.51,164.81209 91,271.61,409.21,503.21 581 5l!675.01 814 2l!920.22,020.92,053.82 149 52,255.41,213.91,327.61,449.71,540.11,611.41,730.11,868.81,954.61,987.42,019.42,037.52,039.32,028.32,040.12,061.62,085.32,103.82,135.42,162.72,195.92,215.02,244.72,267.12,294.942.640.040.848.253.860.070.374.971.876 071.357 167.277 083.670.691.5111.5132.0146.1138.1120.7136.91115159.9214.3221.4203.8244.2274.4255.2256.4233.9278 3314.8101.5175.2211.4221.4198.6256.8278.5240.7263.9282.9246.5232.4232.8235.5227.0240.4252.3273.9272.7314.1292.1315.0318.243.640.340.145.049.856.066.271.467.574 070.858167.178 698.6109.2109.9137.3158.6183.5195.5181.6181.0132 9155.9189.0165.5149.1212.0256.6232.9232.1214.82551286.8116.5168.1169.0168.4168.5224.8271.4215.9223.3233.8244.6226.7207.8209.9218.2223.3235.1260.2251.8273.2268.4291.2281.820.719.219.520.622.824.027.229.527.833 633.327 229.933 840.242.241.553.059.967.169.667.063.946 359.473.769.975.693.5101.799.593.982.798.2114.940.664.462.671.186.599.6107.991.189.695.098.892.079.781.184.385.990.8100.895.3105.8106.4117.6112.51 Indirect business tax and nontax liability plus business transfer payments less subsidies.Source: Department <strong>of</strong> Commerce, Bureau <strong>of</strong> <strong>Economic</strong> Analysis.22.921.120.724.327.032.139.041.939.740 437.531037.144 858.467.068.484 498.7116.4125.9114.6117.186 796.4115.495.673.5118.5154 9133.3138.3132.1156 9171.875.9103.7106.497.282.0125.1163.5124.8133.7138.8145.8134.8128.2128.8133.9137.4144.3159.4156.5167.4162.0173.6169.310.010.610.611.412.613.715 616.817.519119.118 518.520121.121.724.827.832 037.239.345.553.456 466.569.574.576.377.982 0101.9118.194.0105 2125.359.067.468.774.775.284.084.3102.3118.0117.4120.0117.2103.192.989.090.993.9100.3105.9120.7127.4125.4124.012.910.610.113.014.418.423 425.122.221 318.412 518.724 737.345.243.656.666 879.186.769.163.730 229.945.921.1-2.840.672 931.520.138.151746.516.936.337.722.56.841.279.222.515.821.425.817.525.135.944.946.550.559.150.546.734.648.245.3-0.3-.2.3.0.1-.5-1.2-2.1-1.6-37-5.9-66-4.6-66-20.0-39.5-11.0-14.9-16.6-25.0-41.6-43.0-25.7-99-8.5-4.1.29.7-14.5-27 3-17.5-11.04.9-5.3-7.8-8.6-7.63.5-3.8-10.7-17.8-31.7-13.5-2.08.9-31.5-19.58.212.7-3.01.9-4.6-13.7-7.84.9-12.7-12.21.0-7.2-0.7-.2.33.23.94.55.35.65.8566.3554.7505.0.9-7.4-10.9-10.0-12.3-15.9-17.8-18.4-11512.529.455.644.946.745.039.935.314.228.535.9-6.414.738.956.940.849.838.838.342.640.133.425.216.812.811.815.221.827.428.836.036.436.035.435.73.13.54.04.54.85.36.17.48.810113.217 118.119 222.528.328.727.530.636.345.158.271.982 576.787.990.798.3105.8121.6146.6148.5141.3135.379.678.995.890.0103.5109.2128.4150.7148.5149.5147.9148.2143.9140.2140.6140.5136.8137.1133.6133.9134.9133.1132.8284
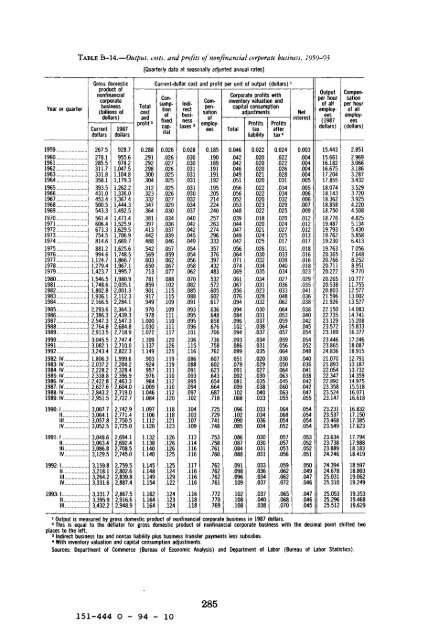
TABLE B-14.—Output, costs, and pr<strong>of</strong>its oj nonfinancial corporate business, 1959-93[Quarterly data at seasonally adjusted annual rates]Year or quarterGross domesticproduct <strong>of</strong>nonfinancialcorporatebusiness(billions <strong>of</strong>dollars)Current 1987dollars dollarsTotalcostandpr<strong>of</strong>it 2Current-dollar cost and pr<strong>of</strong>it per unit <strong>of</strong> output (dollars)»Consumption<strong>of</strong>fixedcapitalIndirectbusinesstaxes 3Compensation<strong>of</strong>smploy-Corporate pr<strong>of</strong>its withinventory valuation andcapital consumptionadjustmentsTotalPr<strong>of</strong>itstaxliabilityPr<strong>of</strong>itsaftertax 4NetinterestOutputper hour<strong>of</strong> allemployees(1987dollars)Compensationper hour<strong>of</strong> allemployees(dollars)195919601961196219631964.,19651966196719681969197019711972197319741975197619771978197919801981198219831984198519861987198819891990199119921982: IV..1983: IV..1984: IV..1985: IV..1986: IV..1987: IV...1988: IV..1989: IV..267.5278.1285.5311.7331.8358.1393.5431.0453.4500.5543.3561.4606.4673.3754.5814.6881.2994.61,124.71,279.41,423.71,546.51,748.61,802.81,936.12,166.52,293.62,386.32,547.32,764.82,913.53,045.53,082.13,243.41,806.32,037.22,228.22,338.82,422.82,627.62,843.22,951.5928.7955.6978.21,047.51,104.81,179.31,262.21,336.01,367.41,444.31,492.51,473.41,525.91,629.51,706.91,669.71,625.61,748.51,866.71,967.11,995.71,980.92,035.12,001.32,112.32,284.12,364.32,439.32,547.32,684.82,718.92,747.42,710.02,822.31,999.62,204.22,328.42,396.92,463.32,604.02,719.02,722.70.288.291.292.298.300.304.312.323.332.347.364.381,397.413.442.488.542.569.603.650.713.781.859.901.917.949.970.9781.0001.0301.0721.1091.1371.149.903.924.957.976.9841.0091.0461.0840.026.026.027.026.025.025.025.026.027.029.030.034.036.037.039.046.057.059.062.067.077.088.102.115.115.109.109.111.110.111.117.120.126.125.119.119.111.110.112.110.112.1200.028.030.030.031.031.031.031.030.032.034.037.040.042.042.045.049.054.054.056.058.062.070.082.085.088.091.093.095.095.096.101.106.115.116.086.088.091.093.095.094.097.1020.185.190.189.191.191.192.195.205.214.224.240.257.263.274.296.333.357.376.397.432.483.532.572.605.602.617.636.648.658.676.706.736.758.762.607.602.623.643.654.664.687.7180.046.042.042.046.049.051.056.056.052.053.048.039.044.047.049.042.056.064.071.074.069.061.067.056.076.094.094.084.096.102.094.093.086.099.051.079.091.092.081.099.1020.022.020.020.020.021.020.022.022.020.023.022.018.020.021.024.025.026.030.032.034.035.034.031.023.028.032.030.031.037.038.037.034.031.035.020.029.027.030.035.038.040.0330.024.022.022.026.028.031.034.034.032.029.025.020.024.027.025.017.031.033.039.040.034.027.036.033.048.062.064.053.059.064.057.059.056.064.030.050.064.063.045.060.063.0550.003.004.004.004.004.005.005.006.006.007.009.012.012.012.013.017.018.016.016.018.023.029.035.041.036.038.038.040.042.045.054.054.052.048.040.036.041.038.042.042.047.05515.44315.66116.18216.67517.20417.85518.07418.14318.36218.85818.75018.77619.48719.79319.76219.23019.76320.36520.76620.71120.22220.26520.53820.80321.59621.92622.15022.73523.12923.57223.18923.44623.86524.83621.07021.89322.05422.34722.89223.35823.52423.1472.8512.9693.0663.1863.2873.4323.5293.7203.9254.2204.5084.8255.1345.4305.8586.4137.0567.6488.2528.9519.77010.77711.75512.57713.00213.52714.08314.74115.20815.83316.37717.24618.08718.91512.79113.18713.73214.35914.97515.51816.07116.6181990:1IIIllIV3,007.73,064.13,057.83,052.52,742.92,771.42,750.52,725.01.097.106.112.120.118.118.121.123.104.103.107.109.725.729.741.748.096.102.090.085.033.034.036.034.064.068.054.052.054.054.054.05423.23123.53723.46823.54916.83217.15017.38517.6231991:1IIIllIV3,048.63,063.43,086.83,129.52,694.12,692.42,708.52,745.0.132.138.1401.140.126.126.126.125.113.114.116.116.753.758.761.760.086.087.084.088.030.030.031.031.057.057.053.056.053.052.052.05123.63423.73823.88924.24617.79417.98818.18318.4191992:1IIIllIV3,159.83,218.13,264.23,331.62,759.52,802.62,839.82,887.41.1451.1481.1491.154.125.124.129.122.117.116.116.116.762.762.762.761.091.098.096.109.033.036.034.037.059.062.062.072.050.049.047.04624.39424.67825.03125.31018.59718.80319.06219.2491993:1II3,331.73,395.93,432.22,867.52,916.62,948.91.1621.1641.164.124.123.124.116.118.118.772.770.769.102.108.108.037.040.038.065.068.070.047.046.04525.05325.29625.51219.35319.46819.6291 Output is measured by gross domestic product <strong>of</strong> nonfinancial corporate business in 1987 dollars.2 This is equal to <strong>the</strong> deflator for gross domestic product <strong>of</strong> nonfinancial corporate business with <strong>the</strong> decimal point shifted twoplaces to <strong>the</strong> left.3 Indirect business tax and nontax liability plus business transfer payments less subsidies.4 With inventory valuation and capital consumption adjustments.Sources: Department <strong>of</strong> Commerce (Bureau <strong>of</strong> <strong>Economic</strong> Analysis) and Department <strong>of</strong> Labor (Bureau <strong>of</strong> Labor Statistics).151-444 0 - 9 4 - 1 0285
- Page 1:
S : Sf:' ;: W^W't-^WW': ;, S 4 Si :
- Page 5:
unitedminds
- Page 9 and 10:
Economic Report of the PresidentTo
- Page 11:
the Technology Reinvestment Project
- Page 14:
formed health care system, increase
- Page 19 and 20:
CONTENTSPageCHAPTER 1. A STRATEGY F
- Page 21:
PageProviding Comprehensive Benefit
- Page 24 and 25:
LIST OF CHARTS—CONTINUEDPage3-5 L
- Page 27 and 28:
CHAPTER 1A Strategy for Growth and
- Page 29 and 30:
which have left consumers and busin
- Page 31 and 32:
that growth in both real compensati
- Page 33 and 34:
for inflation was on average roughl
- Page 35 and 36:
Box 1-2.—Saving, Investment, and
- Page 37 and 38:
investments in human capital; inves
- Page 39 and 40:
of the income distribution (Table 1
- Page 41 and 42:
Box 1-3.—Credible Deficit Reducti
- Page 43 and 44:
Chart 1-7 Correlation of Investment
- Page 45 and 46:
Box 1~4*~-A Balanced Budget Amendme
- Page 47 and 48:
This educational record is not good
- Page 49 and 50:
fallen markedly since the 1960s (Ch
- Page 51 and 52:
The development and deployment of n
- Page 53 and 54:
Earlier rounds of GATT talks had fo
- Page 55 and 56:
Chart 1-10 Projected Real Growth Ra
- Page 57 and 58:
are therefore on the public dole. M
- Page 59:
prise communities and be granted sm
- Page 62 and 63:
ingredient that should allow the ec
- Page 64 and 65:
Chart 2-2 National Defense Purchase
- Page 66 and 67:
Chart 2-3 Growth of U.S. Merchandis
- Page 68 and 69:
Chart 2-5 Households: Credit Market
- Page 70 and 71:
THE HEADWINDS ARE MOSTLY CALMINGAs
- Page 72 and 73:
1993, real consumer spending increa
- Page 74 and 75:
RESIDENTIAL INVESTMENTResidential i
- Page 76 and 77:
smallest annual increase in 20 year
- Page 78 and 79:
ments with the Internal Revenue Ser
- Page 80 and 81:
safe-harbor rules for underpayment
- Page 82 and 83:
Chart 2-9 Alternative Measures of t
- Page 84 and 85:
Meanwhile, the Mountain States were
- Page 86 and 87:
inflation is measured by the Blue C
- Page 88 and 89:
Saving, Investment, and Capital Acc
- Page 90 and 91:
the future should be reflected in l
- Page 92 and 93:
Chart 2-15 Dynamic Effects of Defic
- Page 94 and 95:
joyed healthy average real GDP grow
- Page 96 and 97:
Chart 2-16 Personal Income Taxes as
- Page 98 and 99:
TABLE 2-2.— Administration Foreca
- Page 100 and 101:
TABLE 2-3.— Accounting for Growth
- Page 103 and 104:
CHAPTER 3Trends and Recent Developm
- Page 105 and 106:
first quarter of 1991, nonfarm payr
- Page 107 and 108:
cause defense cutbacks have caused
- Page 109 and 110:
UNEMPLOYMENT AND NONEMPLOYMENTThe U
- Page 111 and 112:
Chart 3-3 Civilian Unemployment Rat
- Page 113 and 114:
Chart 3-6 Employment-to-Population
- Page 115 and 116:
Chart 3-8 Ratio of White-Collar to
- Page 117 and 118:
than would be expected given its hi
- Page 119 and 120:
that the natural rate is falling? M
- Page 121 and 122:
SLOW INCOME GROWTHIncome trends hav
- Page 123 and 124:
Chart 3-10 Average Annual Growth of
- Page 125 and 126:
Box 3-3.—Consequences of Producti
- Page 127 and 128:
likely that immigration could expla
- Page 129 and 130:
We do, however, know how many worke
- Page 131 and 132:
size. No data are available on vola
- Page 133 and 134:
BENEFITSOne of the concerns raised
- Page 135 and 136:
edented partnership to develop a nu
- Page 137 and 138:
CHAPTER 4Health Care ReformTHE UNIT
- Page 139 and 140:
make cost-conscious decisions. In a
- Page 141 and 142:
A third rationale for universal cov
- Page 143 and 144:
Box 4-1.—Moral Hazard and Adverse
- Page 145 and 146:
ies depending on one's health statu
- Page 147 and 148:
than people in other countries do,
- Page 149 and 150:
sumers are ill equipped to bring st
- Page 151 and 152:
By itself, the aging of the populat
- Page 153 and 154:
TABLE 4-3.- Sources and Uses of Hea
- Page 155 and 156:
about 65 to 70 cents for a typical
- Page 157 and 158:
THE ARCHITECTURE OF THE HEALTHSECUR
- Page 159 and 160:
etary savings for the Federal Gover
- Page 161 and 162:
contribution, within limits. Outsid
- Page 163 and 164:
salary income, payments from the em
- Page 165 and 166:
TABLE 4-6.—Caps on Premiums by Fi
- Page 167 and 168:
An example will illustrate the proc
- Page 169 and 170:
TABLE 4-9.—Sources and Uses of Fe
- Page 171 and 172:
Chart 4-9 Business Spending on Heal
- Page 173:
Health care reform should set the s
- Page 176 and 177:
and private sectors, addressing env
- Page 178 and 179:
Box 5-1.—Selected National Perfor
- Page 180 and 181:
Box 5-2*—Market PowerFirms are sa
- Page 182 and 183:
ate regulation. For example, State
- Page 184 and 185:
competitiveness of U.S. industry, a
- Page 186 and 187:
Box 5-4.—ExternalitiesAn external
- Page 188 and 189:
in the habitat of the spotted owl r
- Page 190 and 191:
CLIMATE CHANGE ACTION PLANCertain g
- Page 192 and 193:
eral, lays a foundation for broader
- Page 194 and 195:
The Administration's proposal seeks
- Page 196 and 197:
vances in technical know-how have a
- Page 198 and 199:
Investments in R&D are risky. Like
- Page 200 and 201:
1950s and 1960s, and American compa
- Page 202 and 203:
ico and Lawrence Livermore in Calif
- Page 204 and 205:
of industry. MOCs will be affiliate
- Page 206 and 207:
tiveness. Again, the hoped-for resu
- Page 208 and 209:
forts to cut the massive Federal bu
- Page 210 and 211:
TECHNOLOGY POLICY, GROWTH, ANDCOMPE
- Page 212 and 213:
mitment to an open international tr
- Page 214 and 215:
ses, which take such intersectoral
- Page 216 and 217:
An important sectoral development i
- Page 218 and 219:
TABLE 6-3.—Stock of U.S. Outward
- Page 220 and 221:
technical change has been offered a
- Page 222 and 223:
ent account is a broader measure of
- Page 224 and 225:
TABLE 6-6.—Intrafirm Trade as Sha
- Page 226 and 227:
greater access to the Japanese mark
- Page 228 and 229:
the transparency of its trade regim
- Page 230 and 231:
that if the states of the former So
- Page 232 and 233:
Box 6-3.—Mexican Economic Reforms
- Page 234 and 235:
1998, while nontariff barriers on a
- Page 236 and 237:
ward convergence in environmental a
- Page 238 and 239:
Box 6-4.—The Asian "Miracle"Per c
- Page 240 and 241: Box 6-5.—The Economic Impact of t
- Page 242 and 243: development, and environmental clea
- Page 244 and 245: THE TRADE POLICY AGENDABy lowering
- Page 246 and 247: ignated monopolies. It also establi
- Page 248 and 249: The dollar ended 1993 roughly where
- Page 250 and 251: Box 6-7.—Exchange-Rate Volatility
- Page 252 and 253: Chart 6-5 French Franc-Deutsche Mar
- Page 254 and 255: Besides bringing these endeavors to
- Page 257 and 258: LETTER OF TRANSMITTALCOUNCIL OF ECO
- Page 259 and 260: Report to the President on the Acti
- Page 261 and 262: duction budget package, the North A
- Page 263 and 264: Working Group studying cost-benefit
- Page 265 and 266: prepares the Economic Indicators an
- Page 267: Appendix BSTATISTICAL TABLES RELATI
- Page 270 and 271: POPULATION, EMPLOYMENT, WAGES, AND
- Page 272 and 273: AGRICULTURE:PageB-96. Farm income,
- Page 274 and 275: NATIONAL INCOME OR EXPENDITURETABLE
- Page 276 and 277: TABLE B-2.—Gross domestic product
- Page 278 and 279: TABLE B-3.—Implicit price deflato
- Page 280 and 281: TABLE B-4.—Fixed-weighted price i
- Page 282 and 283: TABLE B-5.—Changes in gross domes
- Page 284 and 285: TABLE B-7.—Cross domestic product
- Page 286 and 287: TABLE B-9.—Gross domestic product
- Page 288 and 289: TABLE B-ll.—Gross domestic produc
- Page 292 and 293: TABLE B-15.—Personal consumption
- Page 294 and 295: TABLE B-17.—Gross and net private
- Page 296 and 297: TABLE B-19.—Inventories and final
- Page 298 and 299: TABLE B-21.—Foreign transactions
- Page 300 and 301: TABLE B-23.—Relation of gross dom
- Page 302 and 303: TABLE B-25.—National income by ty
- Page 304 and 305: TABLE B-26.—Sources of personal i
- Page 306 and 307: TABLE B-27.—Disposition of person
- Page 308 and 309: TABLE B-29.—Gross sating and inve
- Page 310 and 311: TABLE B-31.—Median money income (
- Page 312 and 313: TABLE B-33.—Population and the la
- Page 314 and 315: TABLE B-34.—Civilian employment a
- Page 316 and 317: TABLE B-36.—Unemployment by demog
- Page 318 and 319: TABLE B-38.—Civilian labor force
- Page 320 and 321: TABLE B-40.—Civilian unemployment
- Page 322 and 323: TABLE B-42.—Unemployment by durat
- Page 324 and 325: TABLE B-44.—Employees on nonagric
- Page 326 and 327: TABLE B-45.—Hours and earnings in
- Page 328 and 329: TABLE B-47.—Productivity and rela
- Page 330 and 331: PRODUCTION AND BUSINESS ACTIVITYTAB
- Page 332 and 333: TABLE B-51.—Industrial production
- Page 334 and 335: TABLE B-53.—New construction acti
- Page 336 and 337: TABLE B-54.—New housing units sta
- Page 338 and 339: Year or monthTABLE B-56.—Manufact
- Page 340 and 341:
TABLE B-58.—Manufacturers' new an
- Page 342 and 343:
TABLE B-60.—Consumer price indexe
- Page 344 and 345:
TABLE B-61.—Consumer price indexe
- Page 346 and 347:
TABLE B-63.—Changes in consumer p
- Page 348 and 349:
TABLE B-64.—Producer price indexe
- Page 350 and 351:
TABLE B-66.—Producer price indexe
- Page 352 and 353:
TABLE B-67.—Changes in producer p
- Page 354 and 355:
TABLE B-69.—Components of money s
- Page 356 and 357:
TABLE B-70.—Aggregate reserves of
- Page 358 and 359:
TABLE B-72.—Bond yields and inter
- Page 360 and 361:
TABLE B-73.—Total funds raised in
- Page 362 and 363:
TABLE B-74.—Mortgage debt outstan
- Page 364 and 365:
TABLE B-76.—Consumer credit outst
- Page 366 and 367:
TABLE B-78.—Federal receipts, out
- Page 368 and 369:
TABLE B-79.—Federal budget receip
- Page 370 and 371:
TABLE B-81.—Federal and State and
- Page 372 and 373:
TABLE B-83.—State and local gover
- Page 374 and 375:
TABLE B-85.—Interest-bearing publ
- Page 376 and 377:
TABLE B-87.—Estimated ownership o
- Page 378 and 379:
TABLE B-89.—Corporate profits by
- Page 380 and 381:
TABLE B-91.—Sales, profits, and s
- Page 382 and 383:
TABLE B-93.—Sources and uses of f
- Page 384 and 385:
TABLE B-95.—Business formation an
- Page 386 and 387:
19481949195019511952195319541955195
- Page 388 and 389:
TABLE B-99.—Indexes of prices rec
- Page 390 and 391:
TABLE B-101.— Farm business balan
- Page 392 and 393:
TABLE B-103.—U.S. international t
- Page 394 and 395:
TABLE B-104.—U.S. merchandise exp
- Page 396 and 397:
TABLE B-106.—U.S. merchandise exp
- Page 398 and 399:
TABLE B-108.—Industrial productio
- Page 400 and 401:
TABLE B-110.—Foreign exchange rat
- Page 402 and 403:
NATIONAL WEALTHTABLE B-l 12.—Nati
- Page 404:
SUPPLEMENTARY TABLETABLE B-114.—S