- Page 2:
Peter Schneider Extragalactic Astro
- Page 8:
Prof. Dr. Peter Schneider Argelande
- Page 12:
Preface VI ter aspects are discusse
- Page 16:
List of Contents VIII 2.5.1 The Gra
- Page 20:
List of Contents X 5. Active Galact
- Page 24:
List of Contents XII 8. Cosmology I
- Page 28:
List of Contents XIV D. Recommended
- Page 32:
1. Introduction and Overview 2 Fig.
- Page 36:
1. Introduction and Overview 4 othe
- Page 40:
1. Introduction and Overview 6 obje
- Page 44:
1. Introduction and Overview 8 Fig.
- Page 48:
1. Introduction and Overview 10 Fig
- Page 52:
1. Introduction and Overview 12 Fig
- Page 56:
1. Introduction and Overview 14 Fig
- Page 60:
1. Introduction and Overview 16 of
- Page 64:
1. Introduction and Overview 18 app
- Page 68:
1. Introduction and Overview 20 Fig
- Page 72:
1. Introduction and Overview 22 Fig
- Page 76:
1. Introduction and Overview 24 Fig
- Page 80:
1. Introduction and Overview 26 spe
- Page 84:
1. Introduction and Overview 28 Fig
- Page 88:
1. Introduction and Overview 30 Fig
- Page 92:
1. Introduction and Overview 32 Fig
- Page 98:
2. The Milky Way as a Galaxy 35 The
- Page 102:
2.2 Determination of Distances With
- Page 106:
2.2 Determination of Distances With
- Page 110:
2.2 Determination of Distances With
- Page 114:
2.2 Determination of Distances With
- Page 118:
2.3 The Structure of the Galaxy Fig
- Page 122:
2.3 The Structure of the Galaxy a c
- Page 126:
2.3 The Structure of the Galaxy Fig
- Page 130:
2.3 The Structure of the Galaxy B-s
- Page 134:
2.3 The Structure of the Galaxy Fro
- Page 138:
2.3 The Structure of the Galaxy tha
- Page 142: 2.4 Kinematics of the Galaxy 57 2.4
- Page 146: 2.4 Kinematics of the Galaxy which
- Page 150: 2.4 Kinematics of the Galaxy where
- Page 154: 2.4 Kinematics of the Galaxy center
- Page 158: 2.5 The Galactic Microlensing Effec
- Page 162: 2.5 The Galactic Microlensing Effec
- Page 166: 2.5 The Galactic Microlensing Effec
- Page 170: 2.5 The Galactic Microlensing Effec
- Page 174: 2.5 The Galactic Microlensing Effec
- Page 178: 2.5 The Galactic Microlensing Effec
- Page 182: 2.6 The Galactic Center have been e
- Page 186: 2.6 The Galactic Center 79 Fig. 2.3
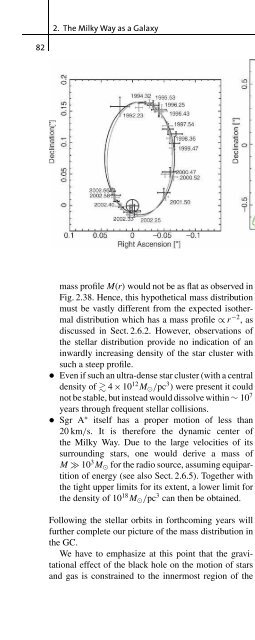
- Page 190: 2.6 The Galactic Center Fig. 2.36.
- Page 196: 2. The Milky Way as a Galaxy 84 any
- Page 202: 3. The World of Galaxies 87 The ins
- Page 206: 3.1 Classification these names are
- Page 210: 3.2 Elliptical Galaxies 91 Fig. 3.5
- Page 214: 3.2 Elliptical Galaxies 93 Fig. 3.7
- Page 218: 3.2 Elliptical Galaxies anisotropic
- Page 222: 3.2 Elliptical Galaxies Fig. 3.12.
- Page 226: 3.3 Spiral Galaxies 99 Fig. 3.14. T
- Page 230: 3.3 Spiral Galaxies 101 Fig. 3.15.
- Page 234: 3.3 Spiral Galaxies luminous galaxi
- Page 238: 3.4 Scaling Relations 105 Fig. 3.20
- Page 242:
3.4 Scaling Relations gas, which ca
- Page 246:
3.5 Black Holes in the Centers of G
- Page 250:
3.5 Black Holes in the Centers of G
- Page 254:
3.6 Extragalactic Distance Determin
- Page 258:
3.6 Extragalactic Distance Determin
- Page 262:
3.7 Luminosity Function of Galaxies
- Page 266:
3.7 Luminosity Function of Galaxies
- Page 270:
3.8 Galaxies as Gravitational Lense
- Page 274:
3.8 Galaxies as Gravitational Lense
- Page 278:
3.8 Galaxies as Gravitational Lense
- Page 282:
3.8 Galaxies as Gravitational Lense
- Page 286:
3.8 Galaxies as Gravitational Lense
- Page 290:
3.9 Population Synthesis 131 Fig. 3
- Page 294:
3.9 Population Synthesis The integr
- Page 298:
3.9 Population Synthesis photometri
- Page 302:
3.9 Population Synthesis 137 Fig. 3
- Page 306:
3.10 Chemical Evolution of Galaxies
- Page 310:
4. Cosmology I: Homogeneous Isotrop
- Page 314:
4.1 Introduction and Fundamental Ob
- Page 318:
4.2 An Expanding Universe the Hubbl
- Page 322:
4.2 An Expanding Universe in which
- Page 326:
4.2 An Expanding Universe physical
- Page 330:
4.2 An Expanding Universe time. Hen
- Page 334:
4.3 Consequences of the Friedmann E
- Page 338:
4.3 Consequences of the Friedmann E
- Page 342:
4.3 Consequences of the Friedmann E
- Page 346:
4.3 Consequences of the Friedmann E
- Page 350:
4.4 Thermal History of the Universe
- Page 354:
4.4 Thermal History of the Universe
- Page 358:
4.4 Thermal History of the Universe
- Page 362:
4.4 Thermal History of the Universe
- Page 366:
4.5 Achievements and Problems of th
- Page 370:
4.5 Achievements and Problems of th
- Page 374:
4.5 Achievements and Problems of th
- Page 378:
5. Active Galactic Nuclei 175 The l
- Page 382:
5.1 Introduction 5.1 Introduction 5
- Page 386:
5.1 Introduction 179 Fig. 5.5. Radi
- Page 390:
5.1 Introduction The synchrotron sp
- Page 394:
5.2 AGN Zoology have in common stro
- Page 398:
5.3 The Central Engine: A Black Hol
- Page 402:
5.3 The Central Engine: A Black Hol
- Page 406:
5.3 The Central Engine: A Black Hol
- Page 410:
5.3 The Central Engine: A Black Hol
- Page 414:
5.3 The Central Engine: A Black Hol
- Page 418:
5.4 Components of an AGN 5.4 Compon
- Page 422:
5.4 Components of an AGN transition
- Page 426:
5.4 Components of an AGN Fig. 5.22.
- Page 430:
5.4 Components of an AGN by magneti
- Page 434:
5.4 Components of an AGN sible to o
- Page 438:
5.4 Components of an AGN ity of an
- Page 444:
5. Active Galactic Nuclei 208 radia
- Page 448:
5. Active Galactic Nuclei 210 Fig.
- Page 452:
5. Active Galactic Nuclei 212 5.5.4
- Page 456:
5. Active Galactic Nuclei 214 elect
- Page 460:
5. Active Galactic Nuclei 216 QSOs
- Page 464:
5. Active Galactic Nuclei 218 tion.
- Page 470:
5.6 AGNs and Cosmology 221 ize hydr
- Page 474:
6. Clusters and Groups of Galaxies
- Page 478:
6.1 The Local Group 225 Table 6.1.
- Page 484:
6. Clusters and Groups of Galaxies
- Page 488:
6. Clusters and Groups of Galaxies
- Page 492:
6. Clusters and Groups of Galaxies
- Page 496:
6. Clusters and Groups of Galaxies
- Page 500:
6. Clusters and Groups of Galaxies
- Page 504:
6. Clusters and Groups of Galaxies
- Page 508:
6. Clusters and Groups of Galaxies
- Page 512:
6. Clusters and Groups of Galaxies
- Page 516:
6. Clusters and Groups of Galaxies
- Page 520:
6. Clusters and Groups of Galaxies
- Page 524:
6. Clusters and Groups of Galaxies
- Page 528:
6. Clusters and Groups of Galaxies
- Page 532:
6. Clusters and Groups of Galaxies
- Page 536:
6. Clusters and Groups of Galaxies
- Page 540:
6. Clusters and Groups of Galaxies
- Page 544:
6. Clusters and Groups of Galaxies
- Page 548:
6. Clusters and Groups of Galaxies
- Page 552:
6. Clusters and Groups of Galaxies
- Page 556:
6. Clusters and Groups of Galaxies
- Page 560:
6. Clusters and Groups of Galaxies
- Page 564:
6. Clusters and Groups of Galaxies
- Page 568:
6. Clusters and Groups of Galaxies
- Page 572:
6. Clusters and Groups of Galaxies
- Page 576:
6. Clusters and Groups of Galaxies
- Page 582:
7. Cosmology II: Inhomogeneities in
- Page 586:
7.2 Gravitational Instability gravi
- Page 590:
7.2 Gravitational Instability i.e.,
- Page 594:
7.3 Description of Density Fluctuat
- Page 598:
7.4 Evolution of Density Fluctuatio
- Page 602:
7.4 Evolution of Density Fluctuatio
- Page 606:
7.5 Non-Linear Structure Evolution
- Page 610:
7.5 Non-Linear Structure Evolution
- Page 614:
7.5 Non-Linear Structure Evolution
- Page 618:
7.5 Non-Linear Structure Evolution
- Page 622:
7.5 Non-Linear Structure Evolution
- Page 626:
7.5 Non-Linear Structure Evolution
- Page 630:
7.5 Non-Linear Structure Evolution
- Page 634:
7.5 Non-Linear Structure Evolution
- Page 638:
7.5 Non-Linear Structure Evolution
- Page 642:
7.7 Origin of the Density Fluctuati
- Page 648:
8. Cosmology III: The Cosmological
- Page 652:
8. Cosmology III: The Cosmological
- Page 656:
8. Cosmology III: The Cosmological
- Page 660:
8. Cosmology III: The Cosmological
- Page 664:
8. Cosmology III: The Cosmological
- Page 668:
8. Cosmology III: The Cosmological
- Page 672:
8. Cosmology III: The Cosmological
- Page 676:
8. Cosmology III: The Cosmological
- Page 680:
8. Cosmology III: The Cosmological
- Page 684:
8. Cosmology III: The Cosmological
- Page 688:
8. Cosmology III: The Cosmological
- Page 692:
8. Cosmology III: The Cosmological
- Page 696:
8. Cosmology III: The Cosmological
- Page 700:
8. Cosmology III: The Cosmological
- Page 704:
8. Cosmology III: The Cosmological
- Page 708:
8. Cosmology III: The Cosmological
- Page 712:
8. Cosmology III: The Cosmological
- Page 716:
8. Cosmology III: The Cosmological
- Page 720:
8. Cosmology III: The Cosmological
- Page 724:
8. Cosmology III: The Cosmological
- Page 728:
8. Cosmology III: The Cosmological
- Page 732:
352 8. Cosmology III: The Cosmologi
- Page 736:
8. Cosmology III: The Cosmological
- Page 740:
9. The Universe at High Redshift 35
- Page 744:
9. The Universe at High Redshift 35
- Page 748:
9. The Universe at High Redshift 36
- Page 752:
9. The Universe at High Redshift 36
- Page 756:
9. The Universe at High Redshift 36
- Page 760:
9. The Universe at High Redshift 36
- Page 764:
9. The Universe at High Redshift 36
- Page 768:
9. The Universe at High Redshift 37
- Page 772:
9. The Universe at High Redshift 37
- Page 776:
9. The Universe at High Redshift 37
- Page 780:
9. The Universe at High Redshift 37
- Page 784:
9. The Universe at High Redshift 37
- Page 788:
9. The Universe at High Redshift 38
- Page 792:
9. The Universe at High Redshift 38
- Page 796:
9. The Universe at High Redshift 38
- Page 800:
9. The Universe at High Redshift 38
- Page 804:
9. The Universe at High Redshift 38
- Page 808:
9. The Universe at High Redshift 39
- Page 812:
9. The Universe at High Redshift 39
- Page 816:
9. The Universe at High Redshift 39
- Page 820:
9. The Universe at High Redshift 39
- Page 824:
9. The Universe at High Redshift 39
- Page 828:
9. The Universe at High Redshift 40
- Page 832:
9. The Universe at High Redshift 40
- Page 836:
9. The Universe at High Redshift 40
- Page 842:
10. Outlook 407 In the final chapte
- Page 846:
10. Outlook telescope will start a
- Page 850:
10. Outlook New windows to the Univ
- Page 854:
10. Outlook understand why the dens
- Page 858:
Appendix
- Page 864:
A. The Electromagnetic Radiation Fi
- Page 868:
A. The Electromagnetic Radiation Fi
- Page 872:
A. The Electromagnetic Radiation Fi
- Page 878:
B. Properties of Stars 425 In this
- Page 882:
B.3 Structure and Evolution of Star
- Page 886:
B.3 Structure and Evolution of Star
- Page 894:
D. Recommended Literature 433 In th
- Page 898:
D.3 Review Articles, Current Litera
- Page 904:
E. Acronyms Used 438 GRB Gamma-Ray
- Page 910:
F. Figure Credits 441 Chapter 1 1.1
- Page 914:
F. Figure Credits 1.25 Source: R. W
- Page 918:
F. Figure Credits Nik Szymanek. bot
- Page 922:
F. Figure Credits 5.5 Credit: Laing
- Page 926:
F. Figure Credits 6.26 Source: http
- Page 930:
F. Figure Credits 8.24 Credit: Hu &
- Page 934:
Subject Index 453 A AB magnitudes 4
- Page 938:
Subject Index 455 Doppler effect 38
- Page 942:
Subject Index 457 -dampedLyα syste
- Page 946:
Subject Index 459 virial theorem 13