and Cosmology
Extragalactic Astronomy and Cosmology: An Introduction
Extragalactic Astronomy and Cosmology: An Introduction
- No tags were found...
You also want an ePaper? Increase the reach of your titles
YUMPU automatically turns print PDFs into web optimized ePapers that Google loves.
3.9 Population Synthesis<br />
The integration limits are not well defined. Typically,<br />
one puts m L ∼ 0.1M ⊙ because less massive stars do<br />
not ignite their hydrogen (<strong>and</strong> are thus brown dwarfs),<br />
<strong>and</strong> m U ∼ 100M ⊙ , because more massive stars have not<br />
been observed. Such very massive stars would be difficult<br />
to observe because of their very short lifetime;<br />
furthermore, the theory of stellar structure tells us that<br />
more massive stars can probably not form a stable configuration<br />
due to excessive radiation pressure. The shape<br />
of the IMF is also subject to uncertainties; in most cases,<br />
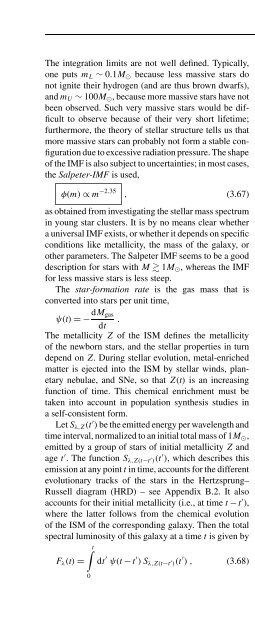
the Salpeter-IMF is used,<br />
φ(m) ∝ m −2.35 , (3.67)<br />
as obtained from investigating the stellar mass spectrum<br />
in young star clusters. It is by no means clear whether<br />
a universal IMF exists, or whether it depends on specific<br />
conditions like metallicity, the mass of the galaxy, or<br />
other parameters. The Salpeter IMF seems to be a good<br />
description for stars with M 1M ⊙ , whereas the IMF<br />
for less massive stars is less steep.<br />
The star-formation rate is the gas mass that is<br />
converted into stars per unit time,<br />
ψ(t) =− dM gas<br />
.<br />
dt<br />
The metallicity Z of the ISM defines the metallicity<br />
of the newborn stars, <strong>and</strong> the stellar properties in turn<br />
depend on Z. During stellar evolution, metal-enriched<br />
matter is ejected into the ISM by stellar winds, planetary<br />
nebulae, <strong>and</strong> SNe, so that Z(t) is an increasing<br />
function of time. This chemical enrichment must be<br />
taken into account in population synthesis studies in<br />
a self-consistent form.<br />
Let S λ,Z (t ′ ) be the emitted energy per wavelength <strong>and</strong><br />
time interval, normalized to an initial total mass of 1M ⊙ ,<br />
emitted by a group of stars of initial metallicity Z <strong>and</strong><br />
age t ′ . The function S λ,Z(t−t ′ )(t ′ ), which describes this<br />
emission at any point t in time, accounts for the different<br />
evolutionary tracks of the stars in the Hertzsprung–<br />
Russell diagram (HRD) – see Appendix B.2. It also<br />
accounts for their initial metallicity (i.e., at time t − t ′ ),<br />
where the latter follows from the chemical evolution<br />
of the ISM of the corresponding galaxy. Then the total<br />
spectral luminosity of this galaxy at a time t is given by<br />
F λ (t) =<br />
∫ t<br />
0<br />
dt ′ ψ(t − t ′ ) S λ,Z(t−t ′ )(t ′ ), (3.68)<br />
thus by the convolution of the star-formation rate with<br />
the spectral energy distribution of the stellar population.<br />
In particular, F λ (t) depends on the star-formation<br />
history.<br />
3.9.2 Evolutionary Tracks in the HRD;<br />
Integrated Spectrum<br />
In order to compute S λ,Z(t−t ′ )(t ′ ), models for stellar<br />
evolution <strong>and</strong> stellar atmospheres are needed. As a reminder,<br />
Fig. 3.46(a) displays the evolutionary tracks<br />
in the HRD. Each track shows the position of a star<br />
with specified mass in the HRD <strong>and</strong> is parametrized<br />
by the time since its formation. Positions of equal time<br />
in the HRD are called isochrones <strong>and</strong> are shown in<br />
Fig. 3.46(b). As time proceeds, fewer <strong>and</strong> fewer massive<br />
stars exist because they quickly leave the main sequence<br />
<strong>and</strong> end up as supernovae or white dwarfs. The number<br />
density of stars along the isochrones depends on the<br />
IMF. The spectrum S λ,Z(t−t ′ )(t ′ ) is then the sum over all<br />
spectra of the stars on an isochrone – see Fig. 3.47(b).<br />
In the beginning, the spectrum <strong>and</strong> luminosity of<br />
a stellar population are dominated by the most massive<br />
stars, which emit intense UV radiation. But after ∼ 10 7<br />
years, the flux below 1000 Å is diminished significantly,<br />
<strong>and</strong> after ∼ 10 8 years, it hardly exists any more. At the<br />
same time, the flux in the NIR increases because the<br />
massive stars evolve into red supergiants.<br />
For 10 8 yr t 10 9 yr, the emission in the NIR remains<br />
high, whereas short-wavelength radiation is more<br />
<strong>and</strong> more diminished. After ∼ 10 9 yr, red giant stars<br />
(RGB stars) account for most of the NIR production.<br />
After ∼ 3 × 10 9 yr, the UV radiation increases again<br />
due to blue stars on the horizontal branch into which<br />
stars evolve after the AGB phase, <strong>and</strong> due to white<br />
dwarfs which are hot when they are born. Between an<br />
age of 4 <strong>and</strong> 13 billion years, the spectrum of a stellar<br />
population evolves fairly little.<br />
Of particular importance is the spectral break located<br />
at about 4000 Å which becomes visible in the spectrum<br />
after a few 10 7 years. This break is caused by a strongly<br />
changing opacity of stellar atmospheres at this wavelength,<br />
mainly due to strong transitions of singly ionized<br />
calcium <strong>and</strong> the Balmer lines of hydrogen. This 4000 Å-<br />
break is one of the most important spectral properties of<br />
galaxies; as we will discuss in Sect. 9.1.2, it allows us to<br />
estimate the redshifts of early-type galaxies from their<br />
133


