

and Cosmology
Extragalactic Astronomy and Cosmology: An Introduction
Extragalactic Astronomy and Cosmology: An Introduction
- No tags were found...

You also want an ePaper? Increase the reach of your titles
YUMPU automatically turns print PDFs into web optimized ePapers that Google loves.
5.1 Introduction<br />
5.1 Introduction<br />
5.1.1 Brief History of AGNs<br />
As long ago as 1908, strong <strong>and</strong> broad emission lines<br />
were discovered in the galaxy NGC 1068. However,<br />
only the systematic analysis by Carl Seyfert in 1943<br />
drew the focus of astronomers to this new class of<br />
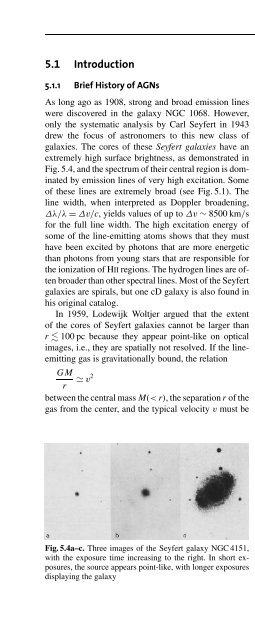
galaxies. The cores of these Seyfert galaxies have an<br />
extremely high surface brightness, as demonstrated in<br />
Fig. 5.4, <strong>and</strong> the spectrum of their central region is dominated<br />
by emission lines of very high excitation. Some<br />
of these lines are extremely broad (see Fig. 5.1). The<br />
line width, when interpreted as Doppler broadening,<br />
Δλ/λ = Δv/c, yields values of up to Δv ∼ 8500 km/s<br />
for the full line width. The high excitation energy of<br />
some of the line-emitting atoms shows that they must<br />
have been excited by photons that are more energetic<br />
than photons from young stars that are responsible for<br />
the ionization of HII regions. The hydrogen lines are often<br />
broader than other spectral lines. Most of the Seyfert<br />
galaxies are spirals, but one cD galaxy is also found in<br />
his original catalog.<br />
In 1959, Lodewijk Woltjer argued that the extent<br />
of the cores of Seyfert galaxies cannot be larger than<br />
r 100 pc because they appear point-like on optical<br />
images, i.e., they are spatially not resolved. If the lineemitting<br />
gas is gravitationally bound, the relation<br />
GM<br />
≃ v 2<br />
r<br />
between the central mass M(< r), the separation r of the<br />
gas from the center, <strong>and</strong> the typical velocity v must be<br />
Fig. 5.4a–c. Three images of the Seyfert galaxy NGC 4151,<br />
with the exposure time increasing to the right. In short exposures,<br />
the source appears point-like, with longer exposures<br />
displaying the galaxy<br />
satisfied. The latter is obtained from the line width: typically<br />
v ∼ 1000 km/s. Therefore, with r 100 pc a mass<br />
estimate is immediately ( obtained,<br />
M 10 10 r<br />
)<br />
M ⊙ . (5.1)<br />
100 pc<br />
Thus, either r ∼ 100 pc, which implies an enormous<br />
mass concentration in the center of these galaxies, or<br />
r is much smaller than the estimated upper limit, which<br />
then implies an enormous energy density inside AGNs.<br />
An important milestone in the history of AGNs<br />
was made with the 3C <strong>and</strong> 3CR radio catalogs<br />
which were completed around 1960. These are surveys<br />
of the northern (δ>−22 ◦ ) sky at 158 MHz <strong>and</strong><br />
178 MHz, with a flux limit of S min = 9 Jy (a Jansky<br />
is the flux unit used by radio astronomers, where<br />
1Jy= 10 −23 erg s −1 cm −2 Hz −1 ). Many of these 3C<br />
sources could be identified with relatively nearby galaxies,<br />
but the low angular resolution of radio telescopes<br />
at these low frequencies <strong>and</strong> the resulting large positional<br />
uncertainty of the respective sources rendered the<br />
identification with optical counterparts very difficult. If<br />
no striking nearby galaxy was found on optical photoplates<br />
within the positional uncertainty, the source was<br />
at first marked as unidentified. 1<br />
In 1963, Thomas Matthews <strong>and</strong> Allan S<strong>and</strong>age<br />
showed that 3C48 is a point-like (“stellar-like”) source<br />
of m = 16 mag. It has a complex optical spectrum consisting<br />
of a blue continuum <strong>and</strong> strong, broad emission<br />
lines which could not be assigned to any atomic transition,<br />
<strong>and</strong> thus could not be identified. In the same<br />
year, Maarten Schmidt succeeded in identifying the radio<br />
source 3C273 with a point-like optical source which<br />
also showed strong <strong>and</strong> broad emission lines at unusual<br />
wavelengths. This was achieved by a lunar eclipse: the<br />
Moon passed in front of the radio source <strong>and</strong> eclipsed it.<br />
From the exact measurement of the time when the radio<br />
emission was blocked <strong>and</strong> became visible again, the position<br />
of the radio source was pinned down accurately.<br />
Schmidt could identify the emission lines of the source<br />
with those of the Balmer series of hydrogen, but at an,<br />
for that time, extremely high redshift of z = 0.158. Presuming<br />
the validity of the Hubble law <strong>and</strong> interpreting<br />
1 The complete optical identification of the 3CR catalog, which was<br />
made possible by the enormously increased angular resolution of interferometric<br />
radio observations <strong>and</strong> thus by a considerably improved<br />
positional accuracy, was finalized only in the 1990s – some of these<br />
luminous radio sources are very faint optically.<br />
177