- Page 2:
Peter Schneider Extragalactic Astro
- Page 8:
Prof. Dr. Peter Schneider Argelande
- Page 12:
Preface VI ter aspects are discusse
- Page 16:
List of Contents VIII 2.5.1 The Gra
- Page 20:
List of Contents X 5. Active Galact
- Page 24:
List of Contents XII 8. Cosmology I
- Page 28:
List of Contents XIV D. Recommended
- Page 32:
1. Introduction and Overview 2 Fig.
- Page 36:
1. Introduction and Overview 4 othe
- Page 40:
1. Introduction and Overview 6 obje
- Page 44:
1. Introduction and Overview 8 Fig.
- Page 48:
1. Introduction and Overview 10 Fig
- Page 52:
1. Introduction and Overview 12 Fig
- Page 56:
1. Introduction and Overview 14 Fig
- Page 60:
1. Introduction and Overview 16 of
- Page 64:
1. Introduction and Overview 18 app
- Page 68:
1. Introduction and Overview 20 Fig
- Page 72:
1. Introduction and Overview 22 Fig
- Page 76:
1. Introduction and Overview 24 Fig
- Page 80:
1. Introduction and Overview 26 spe
- Page 84:
1. Introduction and Overview 28 Fig
- Page 88:
1. Introduction and Overview 30 Fig
- Page 92:
1. Introduction and Overview 32 Fig
- Page 98:
2. The Milky Way as a Galaxy 35 The
- Page 102:
2.2 Determination of Distances With
- Page 106:
2.2 Determination of Distances With
- Page 110:
2.2 Determination of Distances With
- Page 114:
2.2 Determination of Distances With
- Page 118:
2.3 The Structure of the Galaxy Fig
- Page 122:
2.3 The Structure of the Galaxy a c
- Page 126:
2.3 The Structure of the Galaxy Fig
- Page 130:
2.3 The Structure of the Galaxy B-s
- Page 134:
2.3 The Structure of the Galaxy Fro
- Page 138:
2.3 The Structure of the Galaxy tha
- Page 142:
2.4 Kinematics of the Galaxy 57 2.4
- Page 146:
2.4 Kinematics of the Galaxy which
- Page 150:
2.4 Kinematics of the Galaxy where
- Page 154:
2.4 Kinematics of the Galaxy center
- Page 158:
2.5 The Galactic Microlensing Effec
- Page 162:
2.5 The Galactic Microlensing Effec
- Page 166:
2.5 The Galactic Microlensing Effec
- Page 170:
2.5 The Galactic Microlensing Effec
- Page 174:
2.5 The Galactic Microlensing Effec
- Page 178:
2.5 The Galactic Microlensing Effec
- Page 182:
2.6 The Galactic Center have been e
- Page 186:
2.6 The Galactic Center 79 Fig. 2.3
- Page 190:
2.6 The Galactic Center Fig. 2.36.
- Page 194:
2.6 The Galactic Center 83 Fig. 2.3
- Page 198:
2.6 The Galactic Center hence, this
- Page 204:
3. The World of Galaxies 88 million
- Page 208:
3. The World of Galaxies 90 100M
- Page 212:
3. The World of Galaxies 92 Table 3
- Page 216:
3. The World of Galaxies 94 arrives
- Page 220:
96 3. The World of Galaxies This in
- Page 224:
3. The World of Galaxies 98 Boxines
- Page 228:
3. The World of Galaxies 100 Wherea
- Page 232:
3. The World of Galaxies 102 the po
- Page 236:
3. The World of Galaxies 104 The ki
- Page 240:
3. The World of Galaxies 106 Fig. 3
- Page 244:
3. The World of Galaxies 108 where
- Page 248:
3. The World of Galaxies 110 angula
- Page 252:
3. The World of Galaxies 112 Fig. 3
- Page 256:
3. The World of Galaxies 114 Fig. 3
- Page 260:
3. The World of Galaxies 116 LMC sh
- Page 264:
3. The World of Galaxies 118 should
- Page 268:
3. The World of Galaxies 120 Fig. 3
- Page 272:
3. The World of Galaxies 122 Fig. 3
- Page 276:
3. The World of Galaxies 124 The de
- Page 280:
3. The World of Galaxies 126 Fig. 3
- Page 284:
3. The World of Galaxies 128 Fig. 3
- Page 288:
3. The World of Galaxies 130 An eve
- Page 292:
3. The World of Galaxies 132 3.9 Po
- Page 296:
3. The World of Galaxies 134 Fig. 3
- Page 300:
3. The World of Galaxies 136 3.9.4
- Page 304:
3. The World of Galaxies 138 Fig. 3
- Page 308:
3. The World of Galaxies 140 by no
- Page 312:
4. Cosmology I: Homogeneous Isotrop
- Page 316:
4. Cosmology I: Homogeneous Isotrop
- Page 320:
4. Cosmology I: Homogeneous Isotrop
- Page 324:
4. Cosmology I: Homogeneous Isotrop
- Page 328:
4. Cosmology I: Homogeneous Isotrop
- Page 332:
4. Cosmology I: Homogeneous Isotrop
- Page 336:
4. Cosmology I: Homogeneous Isotrop
- Page 340:
4. Cosmology I: Homogeneous Isotrop
- Page 344:
4. Cosmology I: Homogeneous Isotrop
- Page 348:
4. Cosmology I: Homogeneous Isotrop
- Page 352:
4. Cosmology I: Homogeneous Isotrop
- Page 356:
4. Cosmology I: Homogeneous Isotrop
- Page 360:
4. Cosmology I: Homogeneous Isotrop
- Page 364:
4. Cosmology I: Homogeneous Isotrop
- Page 368:
4. Cosmology I: Homogeneous Isotrop
- Page 372:
4. Cosmology I: Homogeneous Isotrop
- Page 376:
4. Cosmology I: Homogeneous Isotrop
- Page 380:
5. Active Galactic Nuclei 176 Fig.
- Page 384:
5. Active Galactic Nuclei 178 the r
- Page 388:
5. Active Galactic Nuclei 180 of re
- Page 392:
5. Active Galactic Nuclei 182 emiss
- Page 396:
5. Active Galactic Nuclei 184 surve
- Page 400:
5. Active Galactic Nuclei 186 chang
- Page 404:
188 5. Active Galactic Nuclei diffe
- Page 408:
5. Active Galactic Nuclei 190 Fig.
- Page 412:
5. Active Galactic Nuclei 192 Fig.
- Page 416:
5. Active Galactic Nuclei 194 For a
- Page 420:
5. Active Galactic Nuclei 196 5.4.2
- Page 424:
5. Active Galactic Nuclei 198 wheth
- Page 428:
5. Active Galactic Nuclei 200 Fig.
- Page 432:
5. Active Galactic Nuclei 202 There
- Page 436:
5. Active Galactic Nuclei 204 Binar
- Page 442:
5.5 Family Relations of AGNs ing t
- Page 446:
5.5 Family Relations of AGNs 209 Fi
- Page 450:
5.5 Family Relations of AGNs relati
- Page 454:
5.5 Family Relations of AGNs 213 Fi
- Page 458:
5.6 AGNs and Cosmology a given freq
- Page 462:
5.6 AGNs and Cosmology Φ(L, z) dL
- Page 466:
5.6 AGNs and Cosmology at very high
- Page 472:
5. Active Galactic Nuclei 222 QSO w
- Page 476:
6. Clusters and Groups of Galaxies
- Page 480:
6. Clusters and Groups of Galaxies
- Page 486:
6.2 Galaxies in Clusters and Groups
- Page 490:
6.2 Galaxies in Clusters and Groups
- Page 494:
6.2 Galaxies in Clusters and Groups
- Page 498:
6.2 Galaxies in Clusters and Groups
- Page 502:
6.2 Galaxies in Clusters and Groups
- Page 506:
6.2 Galaxies in Clusters and Groups
- Page 510:
6.3 X-Ray Radiation from Clusters o
- Page 514:
6.3 X-Ray Radiation from Clusters o
- Page 518:
6.3 X-Ray Radiation from Clusters o
- Page 522:
6.3 X-Ray Radiation from Clusters o
- Page 526:
6.3 X-Ray Radiation from Clusters o
- Page 530:
6.3 X-Ray Radiation from Clusters o
- Page 534:
6.3 X-Ray Radiation from Clusters o
- Page 538:
6.3 X-Ray Radiation from Clusters o
- Page 542:
6.4 Scaling Relations for Clusters
- Page 546:
6.4 Scaling Relations for Clusters
- Page 550:
6.5 Clusters of Galaxies as Gravita
- Page 554:
6.5 Clusters of Galaxies as Gravita
- Page 558:
6.5 Clusters of Galaxies as Gravita
- Page 562:
6.5 Clusters of Galaxies as Gravita
- Page 566:
6.6 Evolutionary Effects M/L ≈ 80
- Page 570:
6.6 Evolutionary Effects 271 Fig. 6
- Page 574:
6.6 Evolutionary Effects Fig. 6.45.
- Page 578:
6.6 Evolutionary Effects satellites
- Page 584:
7. Cosmology II: Inhomogeneities in
- Page 588:
280 7. Cosmology II: Inhomogeneitie
- Page 592:
7. Cosmology II: Inhomogeneities in
- Page 596:
7. Cosmology II: Inhomogeneities in
- Page 600:
7. Cosmology II: Inhomogeneities in
- Page 604:
288 7. Cosmology II: Inhomogeneitie
- Page 608:
7. Cosmology II: Inhomogeneities in
- Page 612:
7. Cosmology II: Inhomogeneities in
- Page 616:
7. Cosmology II: Inhomogeneities in
- Page 620:
7. Cosmology II: Inhomogeneities in
- Page 624:
7. Cosmology II: Inhomogeneities in
- Page 628:
7. Cosmology II: Inhomogeneities in
- Page 632:
302 7. Cosmology II: Inhomogeneitie
- Page 636:
7. Cosmology II: Inhomogeneities in
- Page 640:
306 7. Cosmology II: Inhomogeneitie
- Page 646:
8. Cosmology III: The Cosmological
- Page 650:
8.1 Redshift Surveys of Galaxies a
- Page 654:
8.1 Redshift Surveys of Galaxies SD
- Page 658:
8.1 Redshift Surveys of Galaxies 31
- Page 662:
Physical space Linear regime Redshi
- Page 666:
8.1 Redshift Surveys of Galaxies ie
- Page 670:
8.2 Cosmological Parameters from Cl
- Page 674:
8.2 Cosmological Parameters from Cl
- Page 678:
8.3 High-Redshift Supernovae and th
- Page 682:
8.3 High-Redshift Supernovae and th
- Page 686:
8.4 Cosmic Shear ity one can separa
- Page 690:
8.5 Origin of the Lyman-α Forest F
- Page 694:
8.5 Origin of the Lyman-α Forest p
- Page 698:
8.5 Origin of the Lyman-α Forest 3
- Page 702:
8.6 Angular Fluctuations of the Cos
- Page 706:
8.6 Angular Fluctuations of the Cos
- Page 710:
8.6 Angular Fluctuations of the Cos
- Page 714:
8.6 Angular Fluctuations of the Cos
- Page 718:
8.6 Angular Fluctuations of the Cos
- Page 722:
8.6 Angular Fluctuations of the Cos
- Page 726:
8.7 Cosmological Parameters smaller
- Page 730:
8.7 Cosmological Parameters Fig. 8.
- Page 734:
8.7 Cosmological Parameters measure
- Page 738:
9. The Universe at High Redshift 35
- Page 742:
9.1 Galaxies at High Redshift one e
- Page 746:
9.1 Galaxies at High Redshift Fig.
- Page 750:
9.1 Galaxies at High Redshift neutr
- Page 754: 9.1 Galaxies at High Redshift break
- Page 758: 9.1 Galaxies at High Redshift to sc
- Page 762: 9.1 Galaxies at High Redshift the H
- Page 766: 9.2 New Types of Galaxies 369 Fig.
- Page 770: 9.2 New Types of Galaxies dust. A m
- Page 774: 9.2 New Types of Galaxies 373 Fig.
- Page 778: 9.2 New Types of Galaxies Fig. 9.21
- Page 782: 9.2 New Types of Galaxies tons whic
- Page 786: 9.3 Background Radiation at Smaller
- Page 790: 9.3 Background Radiation at Smaller
- Page 794: 9.4 Reionization of the Universe Th
- Page 798: 9.4 Reionization of the Universe 9.
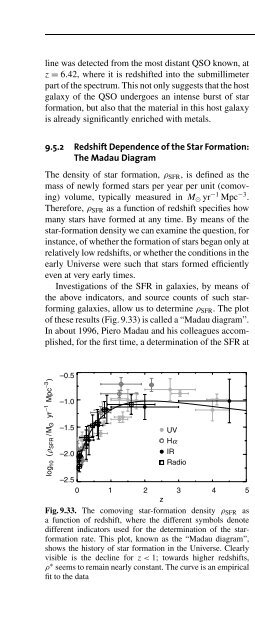
- Page 802: 9.5 The Cosmic Star-Formation Histo
- Page 808: 9. The Universe at High Redshift 39
- Page 812: 9. The Universe at High Redshift 39
- Page 816: 9. The Universe at High Redshift 39
- Page 820: 9. The Universe at High Redshift 39
- Page 824: 9. The Universe at High Redshift 39
- Page 828: 9. The Universe at High Redshift 40
- Page 832: 9. The Universe at High Redshift 40
- Page 836: 9. The Universe at High Redshift 40
- Page 842: 10. Outlook 407 In the final chapte
- Page 846: 10. Outlook telescope will start a
- Page 850: 10. Outlook New windows to the Univ
- Page 854: 10. Outlook understand why the dens
- Page 858:
Appendix
- Page 864:
A. The Electromagnetic Radiation Fi
- Page 868:
A. The Electromagnetic Radiation Fi
- Page 872:
A. The Electromagnetic Radiation Fi
- Page 878:
B. Properties of Stars 425 In this
- Page 882:
B.3 Structure and Evolution of Star
- Page 886:
B.3 Structure and Evolution of Star
- Page 894:
D. Recommended Literature 433 In th
- Page 898:
D.3 Review Articles, Current Litera
- Page 904:
E. Acronyms Used 438 GRB Gamma-Ray
- Page 910:
F. Figure Credits 441 Chapter 1 1.1
- Page 914:
F. Figure Credits 1.25 Source: R. W
- Page 918:
F. Figure Credits Nik Szymanek. bot
- Page 922:
F. Figure Credits 5.5 Credit: Laing
- Page 926:
F. Figure Credits 6.26 Source: http
- Page 930:
F. Figure Credits 8.24 Credit: Hu &
- Page 934:
Subject Index 453 A AB magnitudes 4
- Page 938:
Subject Index 455 Doppler effect 38
- Page 942:
Subject Index 457 -dampedLyα syste
- Page 946:
Subject Index 459 virial theorem 13