- Page 1:
Violence in Nigeria A qualitative a
- Page 5 and 6:
African Studies Centre (ASC) Instit
- Page 7 and 8:
Contents LIST OF FIGURES vii LIST O
- Page 9 and 10:
List of figures 1.1 FRSC and Nigeri
- Page 11 and 12:
List of tables 1.1 Severity index o
- Page 13 and 14:
NDV Niger Delta Vigilante NHRC Nati
- Page 15 and 16:
Foreword The challenge of managing
- Page 17 and 18: Introduction: Arguments for a quali
- Page 19 and 20: customed to poor numbers shaping ho
- Page 21 and 22: arrested and disappeared. As for Bo
- Page 23 and 24: ual killings. As for the link betwe
- Page 25: in 104 deaths between 2006 and 2014
- Page 29 and 30: Trends and patterns of fatal road a
- Page 31 and 32: all accidents on Nigerian roads inv
- Page 33 and 34: sarawa State were killed in a multi
- Page 35 and 36: safety measures. Christie argued th
- Page 37 and 38: fatal road accidents because it rec
- Page 39 and 40: Map 1.1 Fatalities caused by road a
- Page 41 and 42: Figure 1.3 Vehicle types and road a
- Page 43 and 44: Monthly analysis of fatal road acci
- Page 45 and 46: driving, a situation that frequentl
- Page 47 and 48: Table 1.3 Yearly breakdown of road
- Page 49 and 50: However, the administration of Gove
- Page 51 and 52: has been a large increase in the nu
- Page 53 and 54: pecially along the Lagos-Sagamu-Iba
- Page 55 and 56: 39 Conclusion This study has examin
- Page 57 and 58: Patterns and trend analysis of viol
- Page 59 and 60: of Nigeria on the country’s dilap
- Page 61 and 62: a need to bring indigenous investor
- Page 63 and 64: and the population (Oputa Panel Rep
- Page 65 and 66: ating consistent numerical data tha
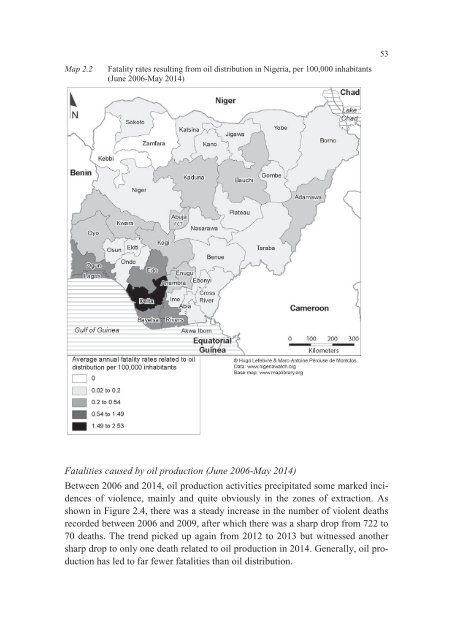
- Page 67: due to oil distribution. Again, of
- Page 71 and 72: Figure 2.5 Number of deaths resulti
- Page 73 and 74: Map 2.4 Fatality rates resulting fr
- Page 75 and 76: Conclusion 59 It is important to st
- Page 77 and 78: Trends and patterns of cattle grazi
- Page 79 and 80: the location of the occurrence of i
- Page 81 and 82: of the lands being equipped with bo
- Page 83 and 84: Jigawa), July (Jigawa and Benue), S
- Page 85 and 86: cattle to graze in violation of the
- Page 87 and 88: Map 8. Fatality rates caused by cat
- Page 89 and 90: Cattle grazing and lethal violence
- Page 91 and 92: BLENCH, R. (2010), Conflict Between
- Page 93 and 94: Trends and patterns of fatalities r
- Page 95 and 96: Political context of witchcraft and
- Page 97 and 98: anyone successful in business or ed
- Page 99 and 100: 83 Figure 4.1 Number of violent dea
- Page 101 and 102: Okechuku had told the Police that t
- Page 103 and 104: The situation in these areas is act
- Page 105 and 106: Conclusion 89 Although the media ha
- Page 107 and 108: Muslims, Christians and religious V
- Page 109 and 110: From this point, the third part of
- Page 111 and 112: several incidences of violence inst
- Page 113 and 114: violent deaths (Figure 5.2) with th
- Page 115 and 116: against the security forces and civ
- Page 117 and 118: Figure 5.3 Violent deaths involving
- Page 119 and 120:
which have a lethal connection betw
- Page 121 and 122:
nored. Based on the data, they repr
- Page 123 and 124:
Table 5.3 Violent deaths of Islamic
- Page 125 and 126:
ment’s JTF to engage members of t
- Page 127 and 128:
ping demonstrates that religious ca
- Page 129 and 130:
the intervention of the security fo
- Page 131 and 132:
Although some of the victims are cr
- Page 133 and 134:
‘Court Martial’, respectively,
- Page 135 and 136:
chosen because the database started
- Page 137 and 138:
an annual average of 59% between Ju
- Page 139 and 140:
123 Figure 6.2 Number of violent de
- Page 141 and 142:
than other of its relations, it wou
- Page 143 and 144:
tervene more in violent incidents i
- Page 145 and 146:
tion of the security forces, notabl
- Page 147 and 148:
Farah Dagogo, a factional leader of
- Page 149 and 150:
ty outfit in the state, the Special
- Page 151 and 152:
however, that both the attackers an
- Page 153 and 154:
to leverage their ethnic and religi
- Page 155 and 156:
CRIMINAL CODE ACT (1990), Laws of t
- Page 157 and 158:
Part II Fieldwork and surveys: A qu
- Page 159 and 160:
A survey of violence-related deaths
- Page 161 and 162:
Figure 7.1 Percentage of violent de
- Page 163 and 164:
one. The LGA is included in Enugu E
- Page 165 and 166:
Table 7.2 Violent events recorded i
- Page 167 and 168:
Table 7.2 Violent events recorded i
- Page 169 and 170:
Table 7.2 Violent events recorded i
- Page 171 and 172:
Table 7.3 Demographic characteristi
- Page 173 and 174:
Table 7.4 Violent events recorded i
- Page 175 and 176:
Figure 7.4 Percentage of causes of
- Page 177 and 178:
A Survey of violence-related deaths
- Page 179 and 180:
Politically, the LGA is divided int
- Page 181 and 182:
This has been a source of problems
- Page 183 and 184:
eferred to as ‘gatekeeping’, an
- Page 185 and 186:
169 Data analysis and presentation
- Page 187 and 188:
Summary of findings As noted earlie
- Page 189 and 190:
Table 8.2 Violence types and fatali
- Page 191 and 192:
News judgment Reporters, who are th
- Page 193 and 194:
cated in Ido-Osun, which were still
- Page 195 and 196:
A study of violence-related deaths
- Page 197 and 198:
flicts. While most of these fatal i
- Page 199 and 200:
tion, as well as poultry farming, c
- Page 201 and 202:
Table 9.2 Violent deaths in Kurfi L
- Page 203 and 204:
Matazu LGA: Socio-economic, politic
- Page 205 and 206:
Table 9.5 Violent deaths in Ingawa
- Page 207 and 208:
Ineffective news media coverage as
- Page 209 and 210:
State. Until they founded their res
- Page 211 and 212:
A study of violence-related deaths
- Page 213 and 214:
Gudu, Gwadabawa, Illela and Sakaba:
- Page 215 and 216:
market their harvests outside Sakab
- Page 217 and 218:
Table 10.2 Violent incidents in Gud
- Page 219 and 220:
Table 10.2 Violent incidents in Gud
- Page 221 and 222:
Table 10.3 Violent incidents in Gwa
- Page 223 and 224:
Table 10.3 Violent incidents in Gwa
- Page 225 and 226:
Compared with Gudu, Gwadabawa LGA e
- Page 227 and 228:
Table 10.4 Violent incidents in Ill
- Page 229 and 230:
frequency of incidents, the princip
- Page 231 and 232:
er, certain parts of Sakaba are kno
- Page 233:
Postscript: The next challenge: Sta