Thailand Power Development Plan 2015-2036

You also want an ePaper? Increase the reach of your titles
YUMPU automatically turns print PDFs into web optimized ePapers that Google loves.
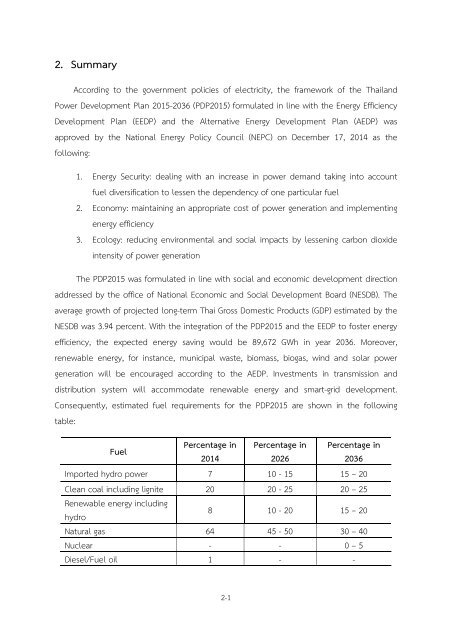
2. Summary<br />
According to the government policies of electricity, the framework of the <strong>Thailand</strong><br />
<strong>Power</strong> <strong>Development</strong> <strong>Plan</strong> <strong>2015</strong>-<strong>2036</strong> (PDP<strong>2015</strong>) formulated in line with the Energy Efficiency<br />
<strong>Development</strong> <strong>Plan</strong> (EEDP) and the Alternative Energy <strong>Development</strong> <strong>Plan</strong> (AEDP) was<br />
approved by the National Energy Policy Council (NEPC) on December 17, 2014 as the<br />
following:<br />
1. Energy Security: dealing with an increase in power demand taking into account<br />
fuel diversification to lessen the dependency of one particular fuel<br />
2. Economy: maintaining an appropriate cost of power generation and implementing<br />
energy efficiency<br />
3. Ecology: reducing environmental and social impacts by lessening carbon dioxide<br />
intensity of power generation<br />
The PDP<strong>2015</strong> was formulated in line with social and economic development direction<br />
addressed by the office of National Economic and Social <strong>Development</strong> Board (NESDB). The<br />
average growth of projected long-term Thai Gross Domestic Products (GDP) estimated by the<br />
NESDB was 3.94 percent. With the integration of the PDP<strong>2015</strong> and the EEDP to foster energy<br />
efficiency, the expected energy saving would be 89,672 GWh in year <strong>2036</strong>. Moreover,<br />
renewable energy, for instance, municipal waste, biomass, biogas, wind and solar power<br />
generation will be encouraged according to the AEDP. Investments in transmission and<br />
distribution system will accommodate renewable energy and smart-grid development.<br />
Consequently, estimated fuel requirements for the PDP<strong>2015</strong> are shown in the following<br />
table:<br />
Fuel<br />
Percentage in Percentage in Percentage in<br />
2014 2026<br />
<strong>2036</strong><br />
Imported hydro power 7 10 - 15 15 – 20<br />
Clean coal including lignite 20 20 - 25 20 – 25<br />
Renewable energy including<br />
hydro<br />
8 10 - 20 15 – 20<br />
Natural gas 64 45 - 50 30 – 40<br />
Nuclear - - 0 – 5<br />
Diesel/Fuel oil 1 - -<br />
2-1