Annual report and accounts 2016

You also want an ePaper? Increase the reach of your titles
YUMPU automatically turns print PDFs into web optimized ePapers that Google loves.
228<br />
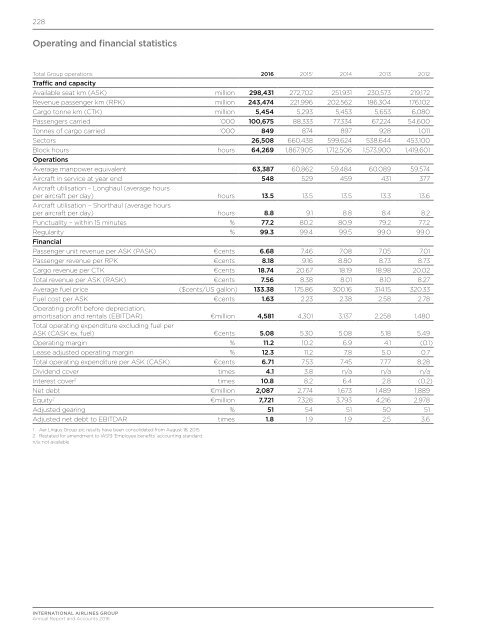
Operating <strong>and</strong> financial statistics<br />
Total Group operations <strong>2016</strong> 2015 1 2014 2013 2012<br />
Traffic <strong>and</strong> capacity<br />
Available seat km (ASK) million 298,431 272,702 251,931 230,573 219,172<br />
Revenue passenger km (RPK) million 243,474 221,996 202,562 186,304 176,102<br />
Cargo tonne km (CTK) million 5,454 5,293 5,453 5,653 6,080<br />
Passengers carried ‘000 100,675 88,333 77,334 67,224 54,600<br />
Tonnes of cargo carried ‘000 849 874 897 928 1,011<br />
Sectors 26,508 660,438 599,624 538,644 453,100<br />
Block hours hours 64,269 1,867,905 1,712,506 1,573,900 1,419,601<br />
Operations<br />
Average manpower equivalent 63,387 60,862 59,484 60,089 59,574<br />
Aircraft in service at year end 548 529 459 431 377<br />
Aircraft utilisation – Longhaul (average hours<br />
per aircraft per day) hours 13.5 13.5 13.5 13.3 13.6<br />
Aircraft utilisation – Shorthaul (average hours<br />
per aircraft per day) hours 8.8 9.1 8.8 8.4 8.2<br />
Punctuality – within 15 minutes % 77.2 80.2 80.9 79.2 77.2<br />
Regularity % 99.3 99.4 99.5 99.0 99.0<br />
Financial<br />
Passenger unit revenue per ASK (PASK) €cents 6.68 7.46 7.08 7.05 7.01<br />
Passenger revenue per RPK €cents 8.18 9.16 8.80 8.73 8.73<br />
Cargo revenue per CTK €cents 18.74 20.67 18.19 18.98 20.02<br />
Total revenue per ASK (RASK) €cents 7.56 8.38 8.01 8.10 8.27<br />
Average fuel price ($cents/US gallon) 133.38 175.86 300.16 314.15 320.33<br />
Fuel cost per ASK €cents 1.63 2.23 2.38 2.58 2.78<br />
Operating profit before depreciation,<br />
amortisation <strong>and</strong> rentals (EBITDAR) €million 4,581 4,301 3,137 2,258 1,480<br />
Total operating expenditure excluding fuel per<br />
ASK (CASK ex. fuel) €cents 5.08 5.30 5.08 5.18 5.49<br />
Operating margin % 11.2 10.2 6.9 4.1 (0.1)<br />
Lease adjusted operating margin % 12.3 11.2 7.8 5.0 0.7<br />
Total operating expenditure per ASK (CASK) €cents 6.71 7.53 7.45 7.77 8.28<br />
Dividend cover times 4.1 3.8 n/a n/a n/a<br />
Interest cover 2 times 10.8 8.2 6.4 2.8 (0.2)<br />
Net debt €million 2,087 2,774 1,673 1,489 1,889<br />
Equity 2 €million 7,721 7,328 3,793 4,216 2,978<br />
Adjusted gearing % 51 54 51 50 51<br />
Adjusted net debt to EBITDAR times 1.8 1.9 1.9 2.5 3.6<br />
1 Aer Lingus Group plc results have been consolidated from August 18, 2015.<br />
2 Restated for amendment to IAS19 ‘Employee benefits’ accounting st<strong>and</strong>ard.<br />
n/a: not available<br />
INTERNATIONAL AIRLINES GROUP<br />
<strong>Annual</strong> Report <strong>and</strong> Accounts <strong>2016</strong>