Annual report and accounts 2016

You also want an ePaper? Increase the reach of your titles
YUMPU automatically turns print PDFs into web optimized ePapers that Google loves.
36<br />
Financial review<br />
IATA market growths<br />
The air travel industry had another strong year <strong>report</strong>ing an<br />
increase in dem<strong>and</strong>. There was an upward trend in the latter<br />
part of the year following the headwinds in the first six months<br />
with terrorist attacks <strong>and</strong> political instability. Average fares fell<br />
benefitting from the lower fuel environment.<br />
Overall capacity increased 6.2 per cent <strong>and</strong> the fastest growing<br />
regions were the Middle East, Europe, Africa <strong>and</strong> Asia, with<br />
passenger load factors down on the Middle East. North<br />
America saw the highest load factor, although it was down 0.4<br />
points. Overall passenger load factor improved 0.1 points to<br />
80.5 per cent.<br />
IATA market growths<br />
Year to<br />
December 31, <strong>2016</strong><br />
Capacity<br />
ASKs<br />
Passenger<br />
load factor<br />
Higher/<br />
(lower)<br />
Europe 4.4% 82.4 0.2 pts<br />
North America 3.7% 83.5 (0.4) pts<br />
Latin America 1.9% 80.8 1.3 pts<br />
Africa 6.3% 68.6 0.1 pts<br />
Middle East 13.5% 74.7 (1.6) pts<br />
Asia Pacific 8.1% 79.7 0.8 pts<br />
Total market 6.2% 80.5 0.1<br />
Source: IATA Air Passenger Market analysis<br />
IAG capacity<br />
In <strong>2016</strong>, IAG increased capacity, measured in available seat<br />
kilometres (ASKs) by 4.3 per cent including Aer Lingus from<br />
January 1 st in the base. With the exception of Africa, Middle East<br />
<strong>and</strong> South Asia, IAG capacity was increased across all regions,<br />
reflecting continued expansion at Vueling <strong>and</strong> Aer Lingus;<br />
restoration of routes as part of Iberia’s Plan de Futuro; <strong>and</strong> new<br />
destinations <strong>and</strong> larger aircraft at British Airways.<br />
IAG passenger load factor was 81.6 per cent which was higher<br />
than the IATA average <strong>and</strong> broadly flat versus last year.<br />
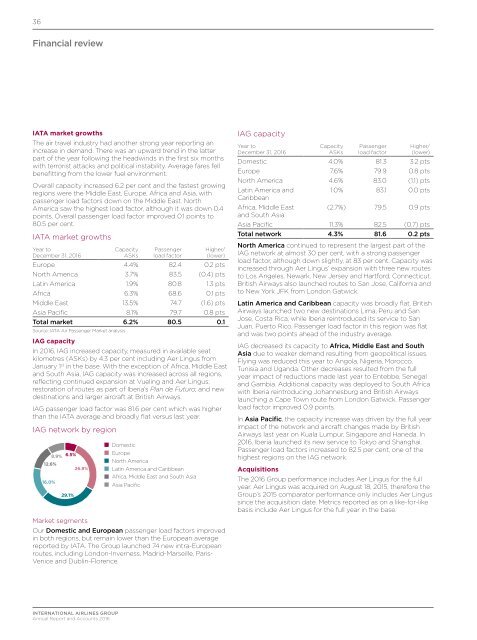
IAG network by region<br />
16.0%<br />
8.9% 6.5%<br />
12.6%<br />
29.1%<br />
26.8%<br />
Domestic<br />
Europe<br />
North America<br />
Latin America <strong>and</strong> Caribbean<br />
Africa, Middle East <strong>and</strong> South Asia<br />
Asia Pacific<br />
IAG capacity<br />
Year to<br />
December 31, <strong>2016</strong><br />
Capacity<br />
ASKs<br />
Passenger<br />
load factor<br />
Higher/<br />
(lower)<br />
Domestic 4.0% 81.3 3.2 pts<br />
Europe 7.6% 79.9 0.8 pts<br />
North America 4.6% 83.0 (1.1) pts<br />
Latin America <strong>and</strong><br />
1.0% 83.1 0.0 pts<br />
Caribbean<br />
Africa, Middle East<br />
(2.7%) 79.5 0.9 pts<br />
<strong>and</strong> South Asia<br />
Asia Pacific 11.3% 82.5 (0.7) pts<br />
Total network 4.3% 81.6 0.2 pts<br />
North America continued to represent the largest part of the<br />
IAG network at almost 30 per cent, with a strong passenger<br />
load factor, although down slightly, at 83 per cent. Capacity was<br />
increased through Aer Lingus’ expansion with three new routes<br />
to Los Angeles, Newark, New Jersey <strong>and</strong> Hartford, Connecticut.<br />
British Airways also launched routes to San Jose, California <strong>and</strong><br />
to New York JFK from London Gatwick.<br />
Latin America <strong>and</strong> Caribbean capacity was broadly flat. British<br />
Airways launched two new destinations Lima, Peru <strong>and</strong> San<br />
Jose, Costa Rica, while Iberia reintroduced its service to San<br />
Juan, Puerto Rico. Passenger load factor in this region was flat<br />
<strong>and</strong> was two points ahead of the industry average.<br />
IAG decreased its capacity to Africa, Middle East <strong>and</strong> South<br />
Asia due to weaker dem<strong>and</strong> resulting from geopolitical issues.<br />
Flying was reduced this year to Angola, Nigeria, Morocco,<br />
Tunisia <strong>and</strong> Ug<strong>and</strong>a. Other decreases resulted from the full<br />
year impact of reductions made last year to Entebbe, Senegal<br />
<strong>and</strong> Gambia. Additional capacity was deployed to South Africa<br />
with Iberia reintroducing Johannesburg <strong>and</strong> British Airways<br />
launching a Cape Town route from London Gatwick. Passenger<br />
load factor improved 0.9 points.<br />
In Asia Pacific, the capacity increase was driven by the full year<br />
impact of the network <strong>and</strong> aircraft changes made by British<br />
Airways last year on Kuala Lumpur, Singapore <strong>and</strong> Haneda. In<br />
<strong>2016</strong>, Iberia launched its new service to Tokyo <strong>and</strong> Shanghai.<br />
Passenger load factors increased to 82.5 per cent, one of the<br />
highest regions on the IAG network.<br />
Acquisitions<br />
The <strong>2016</strong> Group performance includes Aer Lingus for the full<br />
year. Aer Lingus was acquired on August 18, 2015, therefore the<br />
Group’s 2015 comparator performance only includes Aer Lingus<br />
since the acquisition date. Metrics <strong>report</strong>ed as on a like-for-like<br />
basis include Aer Lingus for the full year in the base.<br />
Market segments<br />
Our Domestic <strong>and</strong> European passenger load factors improved<br />
in both regions, but remain lower than the European average<br />
<strong>report</strong>ed by IATA. The Group launched 74 new intra-European<br />
routes, including London-Inverness, Madrid-Marseille, Paris-<br />
Venice <strong>and</strong> Dublin-Florence.<br />
INTERNATIONAL AIRLINES GROUP<br />
<strong>Annual</strong> Report <strong>and</strong> Accounts <strong>2016</strong>