- Page 1 and 2:
Beginning Programming ALL-IN-ONE DE
- Page 3 and 4:
Beginning Programming ALL-IN-ONE DE
- Page 5 and 6:
About the Author I started off as a
- Page 7 and 8:
Acknowledgments This is the part of
- Page 9 and 10:
Contents at a Glance Introduction .
- Page 11 and 12:
Table of Contents Introduction.....
- Page 13 and 14:
Table of Contents xi Finding an Int
- Page 15 and 16:
Table of Contents xiii Playing with
- Page 17 and 18:
Table of Contents xv Using Structur
- Page 19 and 20:
Table of Contents xvii Searching wi
- Page 21 and 22:
Table of Contents xix Book VI: Prog
- Page 23 and 24:
Table of Contents xxi Declaring Con
- Page 25 and 26:
Introduction If you enjoy using a c
- Page 27 and 28:
How to Use This Book 3 means they
- Page 29 and 30:
Book I Getting Started
- Page 31 and 32:
Chapter 1: Getting Started Programm
- Page 33 and 34:
How Computer Programming Works 9 De
- Page 35 and 36:
The History of Computer Programming
- Page 37 and 38:
The History of Computer Programming
- Page 39 and 40:
The History of Computer Programming
- Page 41 and 42:
Figuring Out Programming 17 As a ge
- Page 43 and 44:
Figuring Out Programming 19 ✦ Lin
- Page 45 and 46:
Figuring Out Programming 21 Convert
- Page 47 and 48:
Figuring Out Programming 23 certain
- Page 49 and 50:
Getting Started with Programming 25
- Page 51 and 52:
Knowing Programming versus Knowing
- Page 53 and 54:
Chapter 2: Different Methods for Wr
- Page 55 and 56:
Spaghetti Programming without a Pla
- Page 57 and 58:
Planning Ahead with Structured Prog
- Page 59 and 60:
Planning Ahead with Structured Prog
- Page 61 and 62:
Planning Ahead with Structured Prog
- Page 63 and 64:
Making User Interfaces with Event-D
- Page 65 and 66:
Making User Interfaces with Event-D
- Page 67 and 68:
Organizing a Program with Object-Or
- Page 69 and 70:
Organizing a Program with Object-Or
- Page 71 and 72:
Organizing a Program with Object-Or
- Page 73 and 74:
Chapter 3: Types of Programming Lan
- Page 75 and 76:
Choosing Your First Language 51 ext
- Page 77 and 78:
Teaching Languages 53 Principles Be
- Page 79 and 80:
Teaching Languages 55 The Interacti
- Page 81 and 82:
Teaching Languages 57 near future.
- Page 83 and 84:
Teaching Languages 59 The main disa
- Page 85 and 86:
Teaching Languages 61 Book I Chapte
- Page 87 and 88:
“Curly Bracket” Languages 63
- Page 89 and 90:
“Curly Bracket” Languages 65 Th
- Page 91 and 92:
“Curly Bracket” Languages 67 C#
- Page 93 and 94:
“Curly Bracket” Languages 69 Vi
- Page 95 and 96:
Artificial Intelligence Languages 7
- Page 97 and 98:
Scripting Languages 73 2. From the
- Page 99 and 100:
Scripting Languages 75 In compariso
- Page 101 and 102:
Scripting Languages 77 Transferring
- Page 103 and 104:
Database Programming Languages 79 @
- Page 105 and 106:
Comparing Programming Languages 81
- Page 107 and 108:
Chapter 4: Programming Tools In Thi
- Page 109 and 110:
Choosing a Compiler 85 3. Choose a
- Page 111 and 112:
Choosing a Compiler 87 than other c
- Page 113 and 114:
Choosing a Compiler 89 With a cross
- Page 115 and 116:
Finding an Interpreter 91 In the ol
- Page 117 and 118:
Compiling to a Virtual Machine 93 C
- Page 119 and 120:
Writing a Program with an Editor 95
- Page 121 and 122:
Fixing a Program with a Debugger 97
- Page 123 and 124:
Fixing a Program with a Debugger 99
- Page 125 and 126:
Fixing a Program with a Debugger 10
- Page 127 and 128:
Creating a Help File 103 Obviously,
- Page 129 and 130:
Dissecting Programs with a Disassem
- Page 131 and 132:
Chapter 5: Managing Large Projects
- Page 133 and 134:
Software Engineering Methods 109 Fi
- Page 135 and 136:
Software Engineering Methods 111 de
- Page 137 and 138:
Software Engineering Methods 113 Ad
- Page 139 and 140:
Automating Software Engineering wit
- Page 141 and 142:
Automating Software Engineering wit
- Page 143 and 144:
Automating Software Engineering wit
- Page 145 and 146:
Automating Software Engineering wit
- Page 147 and 148:
The Pros and Cons of Software Engin
- Page 149 and 150:
Book II Programming Basics
- Page 151 and 152:
Chapter 1: How Programs Work In Thi
- Page 153 and 154:
Using Keywords as Building Blocks 1
- Page 155 and 156:
Organizing a Program 131 So if your
- Page 157 and 158:
Dividing a Program into Subprograms
- Page 159 and 160:
Dividing a Program into Objects 135
- Page 161 and 162:
Dividing a Program into Objects 137
- Page 163 and 164:
Creating a User Interface 139 The u
- Page 165 and 166:
Chapter 2: Variables, Data Types, a
- Page 167 and 168:
Declaring Variables 143 This BASIC
- Page 169 and 170:
Declaring Variables 145 You can alw
- Page 171 and 172:
Declaring Variables 147 Every progr
- Page 173 and 174:
Using Different Data Types 149 type
- Page 175 and 176:
Retrieving Data from a Variable 151
- Page 177 and 178:
Using Constant Values 153 Using Con
- Page 179 and 180:
Defining the Scope of a Variable 15
- Page 181 and 182:
Defining the Scope of a Variable 15
- Page 183 and 184:
Defining the Scope of a Variable 15
- Page 185 and 186:
Chapter 3: Manipulating Data In Thi
- Page 187 and 188:
Using Math to Manipulate Numbers 16
- Page 189 and 190:
Using Math to Manipulate Numbers 16
- Page 191 and 192:
Manipulating Strings 167 Most progr
- Page 193 and 194:
Finding Strings with Regular Expres
- Page 195 and 196:
Finding Strings with Regular Expres
- Page 197 and 198:
Using Comparison Operators 173 Comp
- Page 199 and 200:
Using Boolean Operators 175 Most pr
- Page 201 and 202:
Using Boolean Operators 177 So if t
- Page 203 and 204:
Converting Data Types 179 Both type
- Page 205 and 206:
Chapter 4: Making Decisions by Bran
- Page 207 and 208:
Picking One Choice with the IF-THEN
- Page 209 and 210:
Picking Three or More Choices with
- Page 211 and 212:
Picking Three or More Choices with
- Page 213 and 214:
Playing with Multiple Boolean Opera
- Page 215 and 216:
Making Multiple Choices with the SE
- Page 217 and 218:
Making Multiple Choices with the SE
- Page 219 and 220:
Making Multiple Choices with the SE
- Page 221 and 222:
Making Multiple Choices with the SE
- Page 223 and 224:
Chapter 5: Repeating Commands by Lo
- Page 225 and 226:
Looping a Fixed Number of Times wit
- Page 227 and 228:
Looping a Fixed Number of Times wit
- Page 229 and 230:
Looping a Fixed Number of Times wit
- Page 231 and 232:
Looping Zero or More Times with the
- Page 233 and 234:
Playing with Nested Loops 209 This
- Page 235 and 236:
Checking Your Loops 211 Outer loop
- Page 237 and 238:
Chapter 6: Breaking a Large Program
- Page 239 and 240:
Creating and Using Subprograms 215
- Page 241 and 242:
Creating and Using Subprograms 217
- Page 243 and 244:
Passing Parameters 219 The #include
- Page 245 and 246:
Passing Parameters 221 Figure 6-5:
- Page 247 and 248:
Passing Parameters 223 When you pas
- Page 249 and 250:
Passing Parameters 225 DIM Temp AS
- Page 251 and 252:
Repeating a Subprogram with Recursi
- Page 253 and 254:
Repeating a Subprogram with Recursi
- Page 255 and 256:
Chapter 7: Breaking a Large Program
- Page 257 and 258:
How Object-Oriented Programming Wor
- Page 259 and 260:
Encapsulation Isolates Data and Sub
- Page 261 and 262:
Encapsulation Isolates Data and Sub
- Page 263 and 264:
Sharing Code with Inheritance 239 S
- Page 265 and 266:
Sharing Code with Inheritance 241 F
- Page 267 and 268:
Design Patterns 243 However, when y
- Page 269 and 270:
Design Patterns 245 The flyweight p
- Page 271 and 272:
Object-Oriented Languages 247 Becau
- Page 273 and 274:
Real-Life Programming Examples 249
- Page 275 and 276:
Real-Life Programming Examples 251
- Page 277 and 278:
Real-Life Programming Examples 253
- Page 279 and 280:
Real-Life Programming Examples 255
- Page 281 and 282:
Real-Life Programming Examples 257
- Page 283 and 284:
Chapter 8: Reading and Saving Files
- Page 285 and 286:
Storing Data in Text Files 261 A co
- Page 287 and 288:
Storing Data in Text Files 263 Read
- Page 289 and 290:
Storing Fixed Size Data in Random-A
- Page 291 and 292:
Storing Fixed Size Data in Random-A
- Page 293 and 294:
Storing Varying Size Data in Untype
- Page 295 and 296:
Using Database Files 271 Figure 8-5
- Page 297 and 298:
Using Database Files 273 Think of a
- Page 299 and 300:
Using Database Files 275 When using
- Page 301 and 302:
Chapter 9: Documenting Your Program
- Page 303 and 304:
Adding Comments to Source Code 279
- Page 305 and 306:
Adding Comments to Source Code 281
- Page 307 and 308:
Adding Comments to Source Code 283
- Page 309 and 310:
Writing Software Documentation 285
- Page 311 and 312:
Writing Software Documentation 287
- Page 313 and 314:
Chapter 10: Principles of User Inte
- Page 315 and 316:
The Evolution of User Interfaces 29
- Page 317 and 318:
Elements of a User Interface 293 GU
- Page 319 and 320:
Elements of a User Interface 295 Fi
- Page 321 and 322:
Elements of a User Interface 297 If
- Page 323 and 324:
Elements of a User Interface 299 Fi
- Page 325 and 326:
Elements of a User Interface 301 Fi
- Page 327 and 328:
Designing a User Interface 303 diff
- Page 329 and 330:
Designing a User Interface 305 A we
- Page 331 and 332:
Designing a User Interface 307 Figu
- Page 333 and 334:
Book III Data Structures
- Page 335 and 336:
Chapter 1: Structures and Arrays In
- Page 337 and 338:
Using Structures 313 If you wanted
- Page 339 and 340:
Using an Array 315 the array, which
- Page 341 and 342:
Using an Array 317 Perkins has empl
- Page 343 and 344:
Working with Resizable Arrays 319 D
- Page 345 and 346:
Working with Multi-Dimensional Arra
- Page 347 and 348:
Using Structures with Arrays 323 Th
- Page 349 and 350: Drawbacks of Arrays 325 To store da
- Page 351 and 352: Drawbacks of Arrays 327 Suppose you
- Page 353 and 354: Chapter 2: Sets and Linked Lists In
- Page 355 and 356: Using Sets 331 Adding (and deleting
- Page 357 and 358: Using Sets 333 This command asks th
- Page 359 and 360: Using Sets 335 Bill Evans John Doe
- Page 361 and 362: Using Linked Lists 337 This tells t
- Page 363 and 364: Using Linked Lists 339 Each time yo
- Page 365 and 366: Drawbacks of Sets and Linked Lists
- Page 367 and 368: Drawbacks of Sets and Linked Lists
- Page 369 and 370: Chapter 3: Collections and Dictiona
- Page 371 and 372: Using a Collection 347 Every elemen
- Page 373 and 374: Using a Collection 349 When you del
- Page 375 and 376: Using a Collection 351 Figure 3-6:
- Page 377 and 378: Understanding Hash Tables 353 Every
- Page 379 and 380: Understanding Hash Tables 355 VP Ke
- Page 381 and 382: Understanding Hash Tables 357 ✦ D
- Page 383 and 384: Understanding Hash Tables 359 In ge
- Page 385 and 386: Chapter 4: Stacks, Queues, and Dequ
- Page 387 and 388: Using a Stack 363 Like a collection
- Page 389 and 390: Using Queues 365 Counting and searc
- Page 391 and 392: Using Queues 367 Adding data to a q
- Page 393 and 394: Using Queues 369 Figure 4-6: The Pe
- Page 395 and 396: Using Deques 371 Initially, a deque
- Page 397 and 398: Using Deques 373 Figure 4-11: The U
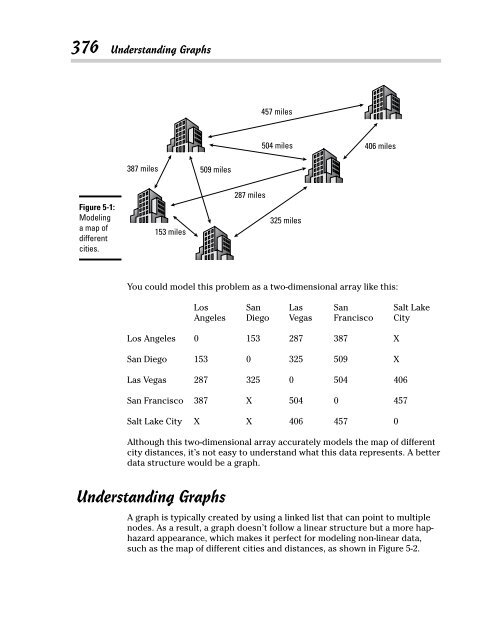
- Page 399: Chapter 5: Graphs and Trees In This
- Page 403 and 404: Understanding Graphs 379 Figure 5-4
- Page 405 and 406: Creating Trees 381 Figure 5-5: A tr
- Page 407 and 408: Creating Trees 383 For example, an
- Page 409 and 410: Taking Action on Trees 385 Traversi
- Page 411 and 412: Taking Action on Trees 387 10 8 12
- Page 413 and 414: Taking Action on Trees 389 10 8 12
- Page 415 and 416: Book IV Algorithms
- Page 417 and 418: Chapter 1: Sorting Algorithms In Th
- Page 419 and 420: Using Bubble Sort 395 32 9 74 21 Or
- Page 421 and 422: Using Insertion Sort 397 32 9 74 21
- Page 423 and 424: Using Shell Sort 399 32 9 74 21 50
- Page 425 and 426: Using Heap Sort 401 Heap sort dumps
- Page 427 and 428: Using Merge Sort 403 94 46 74 21 32
- Page 429 and 430: Using Quick Sort 405 Using Quick So
- Page 431 and 432: Comparing Sorting Algorithms 407 If
- Page 433 and 434: Chapter 2: Searching Algorithms In
- Page 435 and 436: Sequential Search 411 Backward or f
- Page 437 and 438: Sequential Search 413 Binary search
- Page 439 and 440: Sequential Search 415 Fibonacci num
- Page 441 and 442: Using Indexes 417 102 John Smith 55
- Page 443 and 444: Adversarial Search 419 The more lev
- Page 445 and 446: Adversarial Search 421 So if the co
- Page 447 and 448: Chapter 3: String Searching In This
- Page 449 and 450: Sequential Text Search 425 In this
- Page 451 and 452:
Sequential Text Search 427 The Shif
- Page 453 and 454:
Searching with Regular Expressions
- Page 455 and 456:
Searching Phonetically 431 Both sym
- Page 457 and 458:
Searching Phonetically 433 If you h
- Page 459 and 460:
Chapter 4: Data Compression Algorit
- Page 461 and 462:
Lossless Data Compression Algorithm
- Page 463 and 464:
Lossless Data Compression Algorithm
- Page 465 and 466:
Lossless Data Compression Algorithm
- Page 467 and 468:
Lossy Data Compression 443 Basicall
- Page 469 and 470:
Chapter 5: Encryption Algorithms In
- Page 471 and 472:
The Basics of Encryption 447 in a m
- Page 473 and 474:
The Basics of Encryption 449 Stream
- Page 475 and 476:
The Basics of Encryption 451 Electr
- Page 477 and 478:
Symmetric/Asymmetric Encryption Alg
- Page 479 and 480:
Cracking Encryption 455 Sender’s
- Page 481 and 482:
Cracking Encryption 457 Instead of
- Page 483 and 484:
Cracking Encryption 459 Code cracki
- Page 485 and 486:
Book V Web Programming
- Page 487 and 488:
Chapter 1: HyperText Markup Languag
- Page 489 and 490:
The Structure of an HTML Document 4
- Page 491 and 492:
The Structure of an HTML Document 4
- Page 493 and 494:
Defining the Background 469 Adding
- Page 495 and 496:
Making Tables 471 The anchor point
- Page 497 and 498:
Making Tables 473 Book V Chapter 1
- Page 499 and 500:
Making Tables 475 Column 1 Column
- Page 501 and 502:
Chapter 2: CSS In This Chapter Und
- Page 503 and 504:
Creating Style Classes 479 color :
- Page 505 and 506:
Separating Styles in Files 481 Sepa
- Page 507 and 508:
Cascading Stylesheets 483 If you ha
- Page 509 and 510:
Chapter 3: JavaScript In This Chapt
- Page 511 and 512:
Declaring Variables 487 need to def
- Page 513 and 514:
Using Operators 489 The relational
- Page 515 and 516:
Branching Statements 491 To make th
- Page 517 and 518:
Using Arrays 493 A variation of the
- Page 519 and 520:
Designing User Interfaces 495 A con
- Page 521 and 522:
Chapter 4: PHP In This Chapter Und
- Page 523 and 524:
Declaring Variables 499 Declaring V
- Page 525 and 526:
Using Operators 501 Table 4-3 Logic
- Page 527 and 528:
Branching Statements 503 Command; }
- Page 529 and 530:
Creating Functions 505 If you don
- Page 531 and 532:
Creating Objects 507 Creating Objec
- Page 533 and 534:
Chapter 5: Ruby In This Chapter Un
- Page 535 and 536:
Using Operators 511 # long time to
- Page 537 and 538:
Using Operators 513 Table 5-3 Logic
- Page 539 and 540:
Looping Statements 515 Command else
- Page 541 and 542:
Using Data Structures 517 Using Dat
- Page 543 and 544:
Creating Objects 519 To tell an obj
- Page 545 and 546:
Book VI Programming Language Syntax
- Page 547 and 548:
Chapter 1: C and C++ In This Chapte
- Page 549 and 550:
Declaring Variables 525 Despite min
- Page 551 and 552:
Declaring Variables 527 All integer
- Page 553 and 554:
Using Operators 529 Relational oper
- Page 555 and 556:
Branching Statements 531 Table 1-6
- Page 557 and 558:
Looping Statements 533 switch (expr
- Page 559 and 560:
Data Structures 535 If a function d
- Page 561 and 562:
Using Objects 537 Now you can decla
- Page 563 and 564:
Using Objects 539 To inherit from m
- Page 565 and 566:
Chapter 2: Java and C# In This Chap
- Page 567 and 568:
Declaring Variables 543 The double
- Page 569 and 570:
Using Operators 545 Declaring float
- Page 571 and 572:
Using Operators 547 The increment o
- Page 573 and 574:
Branching Statements 549 if (condit
- Page 575 and 576:
Looping Statements 551 Because no b
- Page 577 and 578:
Data Structures 553 If the function
- Page 579 and 580:
Data Structures 555 You can create
- Page 581 and 582:
Using Objects 557 So if you created
- Page 583 and 584:
Chapter 3: Perl and Python In This
- Page 585 and 586:
Using Operators 561 You can write b
- Page 587 and 588:
Using Operators 563 The relational
- Page 589 and 590:
Branching Statements 565 Table 3-5
- Page 591 and 592:
Looping Statements 567 In Python, t
- Page 593 and 594:
Perl Data Structures 569 A typical
- Page 595 and 596:
Python Data Structures 571 Creating
- Page 597 and 598:
Using Objects 573 After you define
- Page 599 and 600:
Chapter 4: Pascal and Delphi In Thi
- Page 601 and 602:
Declaring Variables 577 Creating Co
- Page 603 and 604:
Declaring Constants 579 Declaring d
- Page 605 and 606:
Branching Statements 581 Table 4-5
- Page 607 and 608:
Looping Statements 583 Looping Stat
- Page 609 and 610:
Data Structures 585 FUNCTION Functi
- Page 611 and 612:
Creating Objects 587 clear a dynami
- Page 613 and 614:
Chapter 5: Visual Basic and REALbas
- Page 615 and 616:
The Structure of a BASIC Program 59
- Page 617 and 618:
Declaring Variables 593 Declaring i
- Page 619 and 620:
Declaring Constants 595 Declaring B
- Page 621 and 622:
Branching Statements 597 Table 5-7
- Page 623 and 624:
Branching Statements 599 The preced
- Page 625 and 626:
Creating Subprograms and Functions
- Page 627 and 628:
Data Structures 603 Data Structures
- Page 629 and 630:
Creating Objects 605 Creating Objec
- Page 631 and 632:
Book VII Applications
- Page 633 and 634:
Chapter 1: Database Management In T
- Page 635 and 636:
The Basics of Databases 611 To retr
- Page 637 and 638:
The Basics of Databases 613 Althoug
- Page 639 and 640:
The Basics of Databases 615 Employe
- Page 641 and 642:
Manipulating Data 617 Tables divide
- Page 643 and 644:
Manipulating Data 619 The Join comm
- Page 645 and 646:
Manipulating Data 621 SET PhoneNumb
- Page 647 and 648:
Database Programming 623 Figure 1-1
- Page 649 and 650:
Chapter 2: Bioinformatics In This C
- Page 651 and 652:
The Basics of Bioinformatics 627 Un
- Page 653 and 654:
Searching Databases 629 ✦ Swiss-P
- Page 655 and 656:
Bioinformatics Programming 631 Alth
- Page 657 and 658:
Chapter 3: Computer Security In Thi
- Page 659 and 660:
Stopping Malware 635 Worms Similar
- Page 661 and 662:
Stopping Hackers 637 Stopping Hacke
- Page 663 and 664:
Secure Computing 639 Forensics If y
- Page 665 and 666:
Secure Computing 641 start. The ide
- Page 667 and 668:
Chapter 4: Artificial Intelligence
- Page 669 and 670:
Problem Solving 645 Game-playing Be
- Page 671 and 672:
Problem Solving 647 Expert System K
- Page 673 and 674:
Problem Solving 649 Humans can unde
- Page 675 and 676:
Problem Solving 651 Such speech rec
- Page 677 and 678:
Machine Learning 653 With LISP, eve
- Page 679 and 680:
Machine Learning 655 Robotics and a
- Page 681 and 682:
`Chapter 5: The Future of Computer
- Page 683 and 684:
Picking an Operating System 659 opt
- Page 685 and 686:
Cross-Platform Programming 661 Unfo
- Page 687 and 688:
Cross-Platform Programming 663 The
- Page 689 and 690:
Cross-Platform Programming 665 Anot
- Page 691 and 692:
The Programming Language of the Fut
- Page 693 and 694:
The Programming Language of the Fut
- Page 695 and 696:
Index Numerics 0 (zero) initializin
- Page 697 and 698:
Index 673 blocks of commands in cur
- Page 699 and 700:
Index 675 dictionaries versus, 352
- Page 701 and 702:
Index 677 database management conne
- Page 703 and 704:
Index 679 enumerated variables (C/C
- Page 705 and 706:
Index 681 hybrid OOP languages, 246
- Page 707 and 708:
Index 683 knowledge base, 646, 647
- Page 709 and 710:
Index 685 modeling, 44-45 Modula-2
- Page 711 and 712:
Index 687 advantages and disadvanta
- Page 713 and 714:
Index 689 looping statements, 600-6
- Page 715 and 716:
Index 691 extreme programming metho
- Page 717 and 718:
Index 693 source code as, 264 tab-d
- Page 719 and 720:
Index 695 as event-driven programmi
- Page 721 and 722:
BUSINESS, CAREERS & PERSONAL FINANC