Responsible gambling - Consumer Affairs Victoria
Responsible gambling - Consumer Affairs Victoria
Responsible gambling - Consumer Affairs Victoria

Create successful ePaper yourself
Turn your PDF publications into a flip-book with our unique Google optimized e-Paper software.
C2<br />
Building awareness – Who gambles?<br />
GAMBLER’S HELP LINE<br />
69<br />
<strong>Responsible</strong> Gambling | Section C: The nature of <strong>gambling</strong><br />
<strong>Consumer</strong> <strong>Affairs</strong> <strong>Victoria</strong> | consumer.vic.gov.au<br />
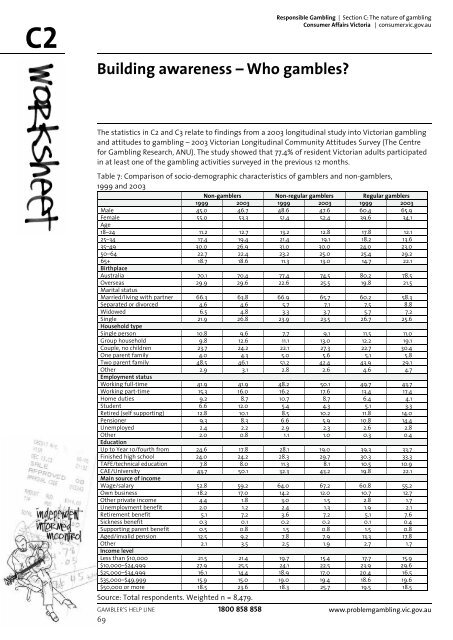
The statistics in C2 and C3 relate to findings from a 2003 longitudinal study into <strong>Victoria</strong>n <strong>gambling</strong><br />
and attitudes to <strong>gambling</strong> – 2003 <strong>Victoria</strong>n Longitudinal Community Attitudes Survey (The Centre<br />
for Gambling Research, ANU). The study showed that 77.4% of resident <strong>Victoria</strong>n adults participated<br />
in at least one of the <strong>gambling</strong> activities surveyed in the previous 12 months.<br />
Table 7: Comparison of socio-demographic characteristics of gamblers and non-gamblers,<br />
1999 and 2003<br />
Non-gamblers Non-regular gamblers Regular gamblers<br />
1999 2003 1999 2003 1999 2003<br />
Male 45.0 46.7 48.6 47.6 60.4 65.9<br />
Female<br />
Age<br />
55.0 53.3 51.4 52.4 39.6 34.1<br />
18–24 11.2 12.7 13.2 12.8 17.8 12.1<br />
25–34 17.4 19.4 21.4 19.1 18.2 13.6<br />
35–49 30.0 26.9 31.0 30.0 24.0 23.0<br />
50–64 22.7 22.4 23.2 25.0 25.4 29.2<br />
65+<br />
Birthplace<br />
18.7 18.6 11.3 13.0 14.7 22.1<br />
Australia 70.1 70.4 77.4 74.5 80.2 78.5<br />
Overseas<br />
Marital status<br />
29.9 29.6 22.6 25.5 19.8 21.5<br />
Married/living with partner 66.3 63.8 66.9 65.7 60.2 58.3<br />
Separated or divorced 4.6 4.6 5.7 7.1 7.5 8.8<br />
Widowed 6.5 4.8 3.3 3.7 5.7 7.2<br />
Single<br />
Household type<br />
21.9 26.8 23.9 23.5 26.7 25.6<br />
Single person 10.8 9.6 7.7 9.1 11.5 11.0<br />
Group household 9.8 12.6 11.1 13.0 12.2 19.1<br />
Couple, no children 23.7 24.2 22.1 27.3 22.7 30.4<br />
One parent family 4.0 4.3 5.0 5.6 5.1 5.8<br />
Two parent family 48.5 46.1 51.2 42.4 43.9 29.1<br />
Other<br />
Employment status<br />
2.9 3.1 2.8 2.6 4.6 4.7<br />
Working full-time 41.9 41.9 48.2 50.1 49.7 43.7<br />
Working part-time 15.3 16.0 16.2 17.6 13.4 17.4<br />
Home duties 9.2 8.7 10.7 8.7 6.4 4.1<br />
Student 6.6 12.0 5.4 4.3 5.1 3.3<br />
Retired (self supporting) 12.8 10.1 8.5 10.2 11.8 14.0<br />
Pensioner 9.3 8.3 6.6 5.9 10.8 14.4<br />
Unemployed 2.4 2.2 2.9 2.3 2.6 2.8<br />
Other<br />
Education<br />
2.0 0.8 1.1 1.0 0.3 0.4<br />
Up to Year 10/fourth from 24.6 17.8 28.1 19.0 39.3 33.7<br />
Finished high school 24.0 24.2 28.3 29.7 30.3 33.3<br />
TAFE/technical education 7.8 8.0 11.3 8.1 10.5 10.9<br />
CAE/University<br />
Main source of income<br />
43.7 50.1 32.3 43.2 19.8 22.1<br />
Wage/salary 52.8 59.2 64.0 67.2 60.8 55.2<br />
Own business 18.2 17.0 14.2 12.0 10.7 12.7<br />
Other private income 4.4 1.8 3.0 1.5 2.8 1.7<br />
Unemployment benefit 2.0 1.2 2.4 1.3 1.9 2.1<br />
Retirement benefit 5.1 7.2 3.6 7.2 5.1 7.6<br />
Sickness benefit 0.3 0.1 0.2 0.2 0.1 0.4<br />
Supporting parent benefit 0.5 0.8 1.5 0.8 1.5 0.8<br />
Aged/invalid pension 12.5 9.2 7.8 7.9 13.3 17.8<br />
Other<br />
Income level<br />
2.1 3.5 2.5 1.9 2.7 1.7<br />
Less than $10,000 21.5 21.4 19.7 15.4 17.7 15.9<br />
$10,000–$24,999 27.9 25.5 24.1 22.5 23.9 29.6<br />
$25,000–$34,999 16.1 14.4 18.9 17.0 20.4 16.5<br />
$35,000–$49,999 15.9 15.0 19.0 19.4 18.6 19.6<br />
$50,000 or more 18.5 23.6 18.3 25.7 19.5 18.5<br />
Source: Total respondents. Weighted n = 8,479.<br />
1800 858 858 www.problem<strong>gambling</strong>.vic.gov.au