(a) 100 µm - Helmholtz-Zentrum Berlin
(a) 100 µm - Helmholtz-Zentrum Berlin
(a) 100 µm - Helmholtz-Zentrum Berlin

Create successful ePaper yourself
Turn your PDF publications into a flip-book with our unique Google optimized e-Paper software.
8 State of the art<br />
p, c<br />
p, c<br />
1 1<br />
II<br />
1 2<br />
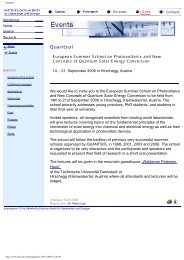
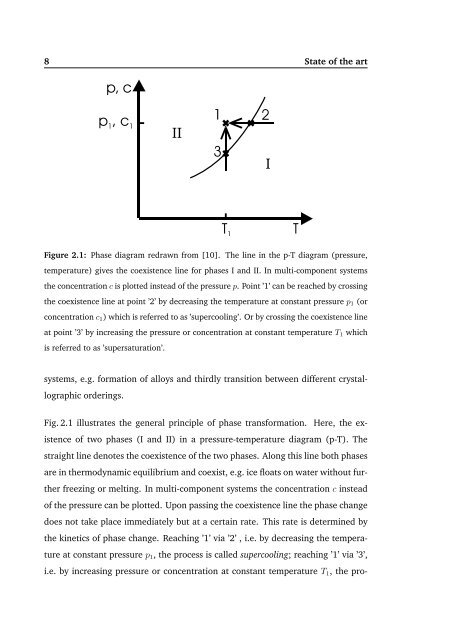
Figure 2.1: Phase diagram redrawn from [10]. The line in the p-T diagram (pressure,<br />
temperature) gives the coexistence line for phases I and II. In multi-component systems<br />
the concentration c is plotted instead of the pressure p. Point ’1’ can be reached by crossing<br />
the coexistence line at point ’2’ by decreasing the temperature at constant pressure p1 (or<br />
concentration c1) which is referred to as ’supercooling’. Or by crossing the coexistence line<br />
at point ’3’ by increasing the pressure or concentration at constant temperature T1 which<br />
is referred to as ’supersaturation’.<br />
systems, e.g. formation of alloys and thirdly transition between different crystal-<br />
lographic orderings.<br />
Fig. 2.1 illustrates the general principle of phase transformation. Here, the ex-<br />
istence of two phases (I and II) in a pressure-temperature diagram (p-T). The<br />
straight line denotes the coexistence of the two phases. Along this line both phases<br />
are in thermodynamic equilibrium and coexist, e.g. ice floats on water without fur-<br />
ther freezing or melting. In multi-component systems the concentration c instead<br />
of the pressure can be plotted. Upon passing the coexistence line the phase change<br />
does not take place immediately but at a certain rate. This rate is determined by<br />
the kinetics of phase change. Reaching ’1’ via ’2’ , i.e. by decreasing the tempera-<br />
ture at constant pressure p1, the process is called supercooling; reaching ’1’ via ’3’,<br />
i.e. by increasing pressure or concentration at constant temperature T1, the pro-<br />
3<br />
T 1<br />
I<br />
T