(a) 100 µm - Helmholtz-Zentrum Berlin
(a) 100 µm - Helmholtz-Zentrum Berlin
(a) 100 µm - Helmholtz-Zentrum Berlin

Create successful ePaper yourself
Turn your PDF publications into a flip-book with our unique Google optimized e-Paper software.
66 Results<br />
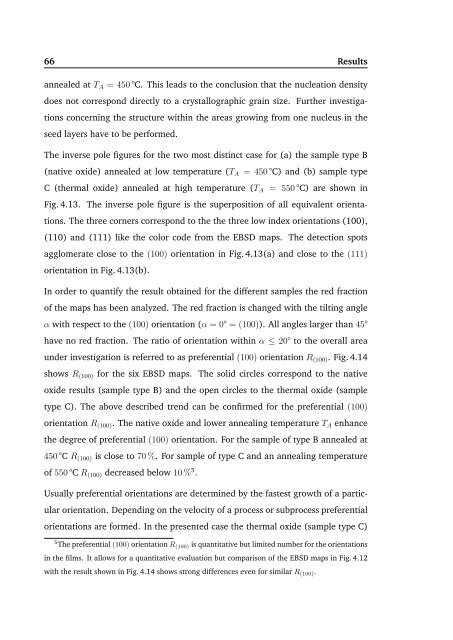
annealed at TA = 450 °C. This leads to the conclusion that the nucleation density<br />
does not correspond directly to a crystallographic grain size. Further investiga-<br />
tions concerning the structure within the areas growing from one nucleus in the<br />
seed layers have to be performed.<br />
The inverse pole figures for the two most distinct case for (a) the sample type B<br />
(native oxide) annealed at low temperature (TA = 450 °C) and (b) sample type<br />
C (thermal oxide) annealed at high temperature (TA = 550 °C) are shown in<br />
Fig. 4.13. The inverse pole figure is the superposition of all equivalent orienta-<br />
tions. The three corners correspond to the the three low index orientations (<strong>100</strong>),<br />
(110) and (111) like the color code from the EBSD maps. The detection spots<br />
agglomerate close to the (<strong>100</strong>) orientation in Fig. 4.13(a) and close to the (111)<br />
orientation in Fig. 4.13(b).<br />
In order to quantify the result obtained for the different samples the red fraction<br />
of the maps has been analyzed. The red fraction is changed with the tilting angle<br />
α with respect to the (<strong>100</strong>) orientation (α = 0° = (<strong>100</strong>)). All angles larger than 45°<br />
have no red fraction. The ratio of orientation within α ≤ 20° to the overall area<br />
under investigation is referred to as preferential (<strong>100</strong>) orientation R(<strong>100</strong>). Fig. 4.14<br />
shows R(<strong>100</strong>) for the six EBSD maps. The solid circles correspond to the native<br />
oxide results (sample type B) and the open circles to the thermal oxide (sample<br />
type C). The above described trend can be confirmed for the preferential (<strong>100</strong>)<br />
orientation R(<strong>100</strong>). The native oxide and lower annealing temperature TA enhance<br />
the degree of preferential (<strong>100</strong>) orientation. For the sample of type B annealed at<br />
450 °C R(<strong>100</strong>) is close to 70 %. For sample of type C and an annealing temperature<br />
of 550 °C R(<strong>100</strong>) decreased below 10 % 5 .<br />
Usually preferential orientations are determined by the fastest growth of a partic-<br />
ular orientation. Depending on the velocity of a process or subprocess preferential<br />
orientations are formed. In the presented case the thermal oxide (sample type C)<br />
5 The preferential (<strong>100</strong>) orientation R(<strong>100</strong>) is quantitative but limited number for the orientations<br />
in the films. It allows for a quantitative evaluation but comparison of the EBSD maps in Fig. 4.12<br />
with the result shown in Fig. 4.14 shows strong differences even for similar R (<strong>100</strong>).