(a) 100 µm - Helmholtz-Zentrum Berlin
(a) 100 µm - Helmholtz-Zentrum Berlin
(a) 100 µm - Helmholtz-Zentrum Berlin

You also want an ePaper? Increase the reach of your titles
YUMPU automatically turns print PDFs into web optimized ePapers that Google loves.
4.1 Interlayer 61<br />
� � �����<br />
1 0 0<br />
8 0<br />
6 0<br />
4 0<br />
2 0<br />
��������<br />
� � ��������<br />
� � ����<br />
0<br />
0 2 4 4 8 7 2 9 6 1 2 0 1 4 4 1 6 8<br />
t [h ] A<br />
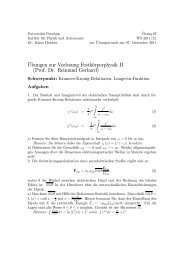
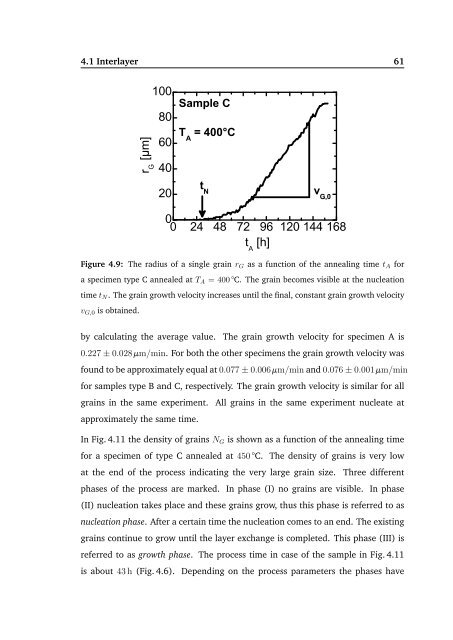
Figure 4.9: The radius of a single grain rG as a function of the annealing time tA for<br />
a specimen type C annealed at TA = 400 °C. The grain becomes visible at the nucleation<br />
time tN. The grain growth velocity increases until the final, constant grain growth velocity<br />
vG,0 is obtained.<br />
by calculating the average value. The grain growth velocity for specimen A is<br />
0.227 ± 0.028 <strong>µm</strong>/min. For both the other specimens the grain growth velocity was<br />
found to be approximately equal at 0.077 ± 0.006 <strong>µm</strong>/min and 0.076 ± 0.001 <strong>µm</strong>/min<br />
for samples type B and C, respectively. The grain growth velocity is similar for all<br />
grains in the same experiment. All grains in the same experiment nucleate at<br />
approximately the same time.<br />
In Fig. 4.11 the density of grains NG is shown as a function of the annealing time<br />
for a specimen of type C annealed at 450 °C. The density of grains is very low<br />
at the end of the process indicating the very large grain size. Three different<br />
phases of the process are marked. In phase (I) no grains are visible. In phase<br />
(II) nucleation takes place and these grains grow, thus this phase is referred to as<br />
nucleation phase. After a certain time the nucleation comes to an end. The existing<br />
grains continue to grow until the layer exchange is completed. This phase (III) is<br />
referred to as growth phase. The process time in case of the sample in Fig. 4.11<br />
is about 43 h (Fig. 4.6). Depending on the process parameters the phases have