GREEN SEED COAT COLOUR RETENTION IN LENTIL - University ...
GREEN SEED COAT COLOUR RETENTION IN LENTIL - University ...
GREEN SEED COAT COLOUR RETENTION IN LENTIL - University ...

Create successful ePaper yourself
Turn your PDF publications into a flip-book with our unique Google optimized e-Paper software.
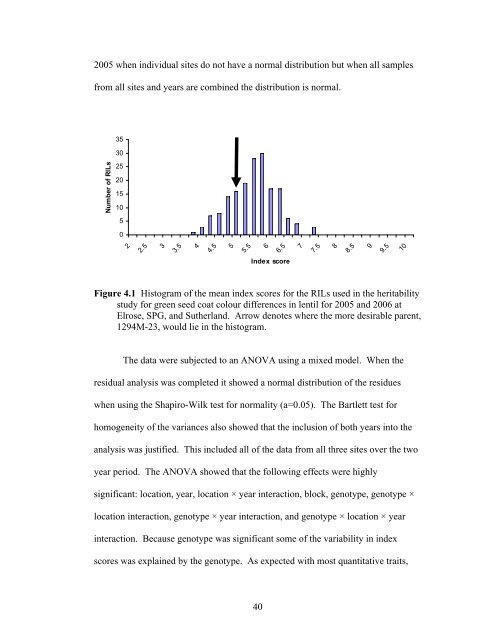
2005 when individual sites do not have a normal distribution but when all samples<br />
from all sites and years are combined the distribution is normal.<br />
Number of RILs<br />
35<br />
30<br />
25<br />
20<br />
15<br />
10<br />
5<br />
0<br />
2<br />
2.5<br />
3<br />
3.5<br />
4<br />
4.5<br />
5<br />
5.5<br />
6<br />
40<br />
6.5<br />
Index score<br />
Figure 4.1 Histogram of the mean index scores for the RILs used in the heritability<br />
study for green seed coat colour differences in lentil for 2005 and 2006 at<br />
Elrose, SPG, and Sutherland. Arrow denotes where the more desirable parent,<br />
1294M-23, would lie in the histogram.<br />
The data were subjected to an ANOVA using a mixed model. When the<br />
residual analysis was completed it showed a normal distribution of the residues<br />
when using the Shapiro-Wilk test for normality (a=0.05). The Bartlett test for<br />
homogeneity of the variances also showed that the inclusion of both years into the<br />
analysis was justified. This included all of the data from all three sites over the two<br />
year period. The ANOVA showed that the following effects were highly<br />
significant: location, year, location × year interaction, block, genotype, genotype ×<br />
location interaction, genotype × year interaction, and genotype × location × year<br />
interaction. Because genotype was significant some of the variability in index<br />
scores was explained by the genotype. As expected with most quantitative traits,<br />
7<br />
7.5<br />
8<br />
8.5<br />
9<br />
9.5<br />
10