The role of physical design and informal communication
The role of physical design and informal communication
The role of physical design and informal communication
Create successful ePaper yourself
Turn your PDF publications into a flip-book with our unique Google optimized e-Paper software.
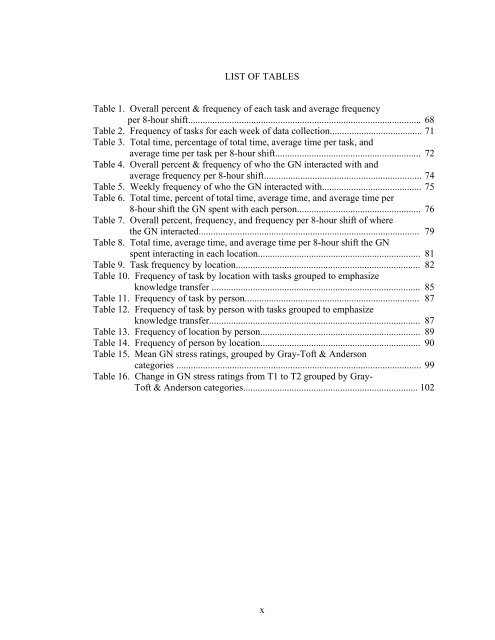
LIST OF TABLES<br />
Table 1. Overall percent & frequency <strong>of</strong> each task <strong>and</strong> average frequency<br />
per 8-hour shift................................................................................................ 68<br />
Table 2. Frequency <strong>of</strong> tasks for each week <strong>of</strong> data collection...................................... 71<br />
Table 3. Total time, percentage <strong>of</strong> total time, average time per task, <strong>and</strong><br />
average time per task per 8-hour shift............................................................ 72<br />
Table 4. Overall percent & frequency <strong>of</strong> who the GN interacted with <strong>and</strong><br />
average frequency per 8-hour shift................................................................. 74<br />
Table 5. Weekly frequency <strong>of</strong> who the GN interacted with......................................... 75<br />
Table 6. Total time, percent <strong>of</strong> total time, average time, <strong>and</strong> average time per<br />
8-hour shift the GN spent with each person................................................... 76<br />
Table 7. Overall percent, frequency, <strong>and</strong> frequency per 8-hour shift <strong>of</strong> where<br />
the GN interacted........................................................................................... 79<br />
Table 8. Total time, average time, <strong>and</strong> average time per 8-hour shift the GN<br />
spent interacting in each location................................................................... 81<br />
Table 9. Task frequency by location............................................................................ 82<br />
Table 10. Frequency <strong>of</strong> task by location with tasks grouped to emphasize<br />
knowledge transfer ...................................................................................... 85<br />
Table 11. Frequency <strong>of</strong> task by person........................................................................ 87<br />
Table 12. Frequency <strong>of</strong> task by person with tasks grouped to emphasize<br />
knowledge transfer....................................................................................... 87<br />
Table 13. Frequency <strong>of</strong> location by person.................................................................. 89<br />
Table 14. Frequency <strong>of</strong> person by location.................................................................. 90<br />
Table 15. Mean GN stress ratings, grouped by Gray-T<strong>of</strong>t & Anderson<br />
categories ..................................................................................................... 99<br />
Table 16. Change in GN stress ratings from T1 to T2 grouped by Gray-<br />
T<strong>of</strong>t & Anderson categories........................................................................ 102<br />
x


