The role of physical design and informal communication
The role of physical design and informal communication
The role of physical design and informal communication

You also want an ePaper? Increase the reach of your titles
YUMPU automatically turns print PDFs into web optimized ePapers that Google loves.
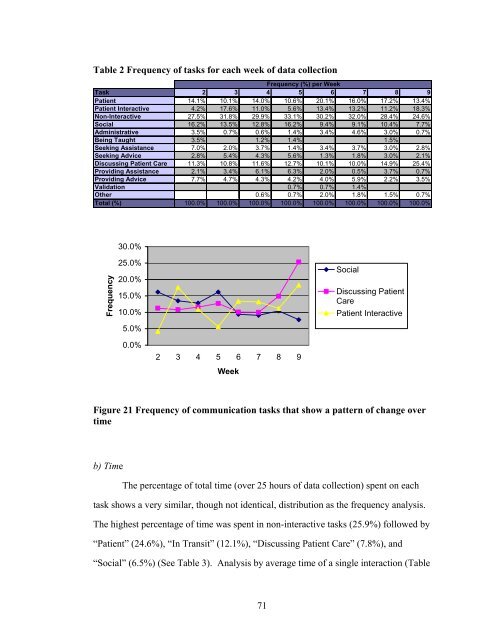
Table 2 Frequency <strong>of</strong> tasks for each week <strong>of</strong> data collection<br />
Frequency (%) per Week<br />
Task 2 3 4 5 6 7 8 9<br />
Patient 14.1% 10.1% 14.0% 10.6% 20.1% 16.0% 17.2% 13.4%<br />
Patient Interactive 4.2% 17.6% 11.0% 5.6% 13.4% 13.2% 11.2% 18.3%<br />
Non-Interactive 27.5% 31.8% 29.9% 33.1% 30.2% 32.0% 28.4% 24.6%<br />
Social 16.2% 13.5% 12.8% 16.2% 9.4% 9.1% 10.4% 7.7%<br />
Administrative 3.5% 0.7% 0.6% 1.4% 3.4% 4.6% 3.0% 0.7%<br />
Being Taught 3.5% 1.2% 1.4% 1.5%<br />
Seeking Assistance 7.0% 2.0% 3.7% 1.4% 3.4% 3.7% 3.0% 2.8%<br />
Seeking Advice 2.8% 5.4% 4.3% 5.6% 1.3% 1.8% 3.0% 2.1%<br />
Discussing Patient Care 11.3% 10.8% 11.6% 12.7% 10.1% 10.0% 14.9% 25.4%<br />
Providing Assistance 2.1% 3.4% 6.1% 6.3% 2.0% 0.5% 3.7% 0.7%<br />
Providing Advice 7.7% 4.7% 4.3% 4.2% 4.0% 5.9% 2.2% 3.5%<br />
Validation 0.7% 0.7% 1.4%<br />
Other 0.6% 0.7% 2.0% 1.8% 1.5% 0.7%<br />
Total (%) 100.0% 100.0% 100.0% 100.0% 100.0% 100.0% 100.0% 100.0%<br />
Frequency<br />
30.0%<br />
25.0%<br />
20.0%<br />
15.0%<br />
10.0%<br />
5.0%<br />
0.0%<br />
2 3 4 5 6 7 8 9<br />
Week<br />
Social<br />
Discussing Patient<br />
Care<br />
Patient Interactive<br />
Figure 21 Frequency <strong>of</strong> <strong>communication</strong> tasks that show a pattern <strong>of</strong> change over<br />
time<br />
b) Time<br />
<strong>The</strong> percentage <strong>of</strong> total time (over 25 hours <strong>of</strong> data collection) spent on each<br />
task shows a very similar, though not identical, distribution as the frequency analysis.<br />
<strong>The</strong> highest percentage <strong>of</strong> time was spent in non-interactive tasks (25.9%) followed by<br />
“Patient” (24.6%), “In Transit” (12.1%), “Discussing Patient Care” (7.8%), <strong>and</strong><br />
“Social” (6.5%) (See Table 3). Analysis by average time <strong>of</strong> a single interaction (Table<br />
71