The role of physical design and informal communication
The role of physical design and informal communication
The role of physical design and informal communication

Create successful ePaper yourself
Turn your PDF publications into a flip-book with our unique Google optimized e-Paper software.
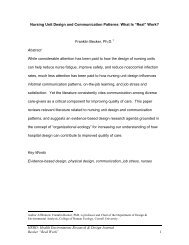
Patient Room<br />
28%<br />
Nurses Station<br />
25%<br />
Break Room<br />
0%<br />
Backstage<br />
4%<br />
Med Room<br />
21%<br />
Corridor<br />
19%<br />
Charge Desk<br />
3%<br />
Figure 28 Overall frequency <strong>of</strong> where the GN interacted over 8 weeks <strong>of</strong> data<br />
collection<br />
b) Time<br />
Table 8 shows the total <strong>and</strong> average amount <strong>of</strong> time the GN spent interacting in<br />
each location over 25 hours <strong>of</strong> data collection, <strong>and</strong> the average amount <strong>of</strong> time during<br />
<strong>and</strong> eight-hour shift. (Note: the total time used to determine the percentages was the<br />
time spent collecting data - 24:50:23 - minus time spent “In Transit” – 2:59:43). <strong>The</strong><br />
percentage <strong>of</strong> total time, over 25 hours <strong>of</strong> data collection, spent in each location shows<br />
a similar distribution as the frequency analysis. However, the percentage <strong>of</strong> total time<br />
spent in the patient room was significantly higher than the percentage calculated in the<br />
frequency analysis. This can be attributed to the fact that the GN had relatively long<br />
interactions in the patient room averaging close to two minutes. Conversely, the<br />
percentage <strong>of</strong> total time spent in the corridor was significantly lower than the<br />
80