Notes to the Financial Statements - Efacec
Notes to the Financial Statements - Efacec
Notes to the Financial Statements - Efacec

Create successful ePaper yourself
Turn your PDF publications into a flip-book with our unique Google optimized e-Paper software.
1.3 Reporting by segments<br />
A business segment is a group of activities and operations involved in <strong>the</strong> supply of products and services subject <strong>to</strong> risks and<br />
benefi ts that are different <strong>to</strong> o<strong>the</strong>r business segments. A geographical segment is involved in supplying products and services in a<br />
specifi c economic environment that is subject <strong>to</strong> different risks and benefi ts that those of segments that operate in o<strong>the</strong>r economic<br />
environments.<br />
1.4 Exchange Rate Conversion<br />
(a) Functional currency and that for presentation purposes<br />
The fi gures included in <strong>the</strong> <strong>Financial</strong> <strong>Statements</strong> of each of <strong>the</strong> Group entities are stated using <strong>the</strong> currency of <strong>the</strong> country in<br />
which <strong>the</strong> unit operates (“The functional currency”). The consolidated <strong>Financial</strong> <strong>Statements</strong> are presented in Euro, this being <strong>the</strong><br />
functional and presentational currency of <strong>the</strong> Group accounts.<br />
(b) Transactions and Balances<br />
Transactions in currencies o<strong>the</strong>r than <strong>the</strong> Euro are converted <strong>to</strong> <strong>the</strong> functional currency using <strong>the</strong> Exchange rate at <strong>the</strong> date of<br />
<strong>the</strong> transaction. Exchange gains and losses arising from <strong>the</strong> payment of transactions and from conversion at <strong>the</strong> rate on <strong>the</strong><br />
balance sheet date of <strong>the</strong> assets and liabilities denominated in a currency o<strong>the</strong>r than <strong>the</strong> Euro, are recognised in <strong>the</strong> Profi t and<br />
Loss account.<br />
(c) Group Companies<br />
The fi nancial results and position of all Group entities (none of which use a currency of a country suffering hyper infl ation) that<br />
have a functional currency different <strong>to</strong> that of account presentation are converted <strong>to</strong> <strong>the</strong> presentation currency as follows:<br />
(I) The assets and liabilities of each balance sheet presented are converted at <strong>the</strong><br />
exchange rate in force at <strong>the</strong> date of <strong>the</strong> <strong>Financial</strong> <strong>Statements</strong>;<br />
(II) Income and expenses of each profi t and loss account are converted at <strong>the</strong> average<br />
Exchange rate; and<br />
(III) The resulting exchange rate differences are shown in Shareholders’ Funds in <strong>the</strong> line<br />
“Reserves”.<br />
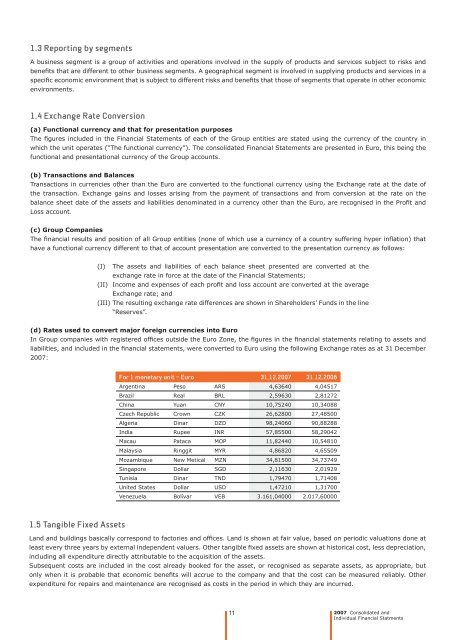
(d) Rates used <strong>to</strong> convert major foreign currencies in<strong>to</strong> Euro<br />
In Group companies with registered offi ces outside <strong>the</strong> Euro Zone, <strong>the</strong> fi gures in <strong>the</strong> fi nancial statements relating <strong>to</strong> assets and<br />
liabilities, and included in <strong>the</strong> fi nancial statements, were converted <strong>to</strong> Euro using <strong>the</strong> following Exchange rates as at 31 December<br />
2007:<br />
1.5 Tangible Fixed Assets<br />
For 1 monetary unit – Euro 31.12.2007 31.12.2006<br />
Argentina Peso ARS 4,63640 4,04517<br />
Brazil Real BRL 2,59630 2,81272<br />
China Yuan CNY 10,75240 10,34088<br />
Czech Republic Crown CZK 26,62800 27,48500<br />
Algeria Dinar DZD 98,24060 90,88288<br />
India Rupee INR 57,85500 58,29042<br />
Macau Pataca MOP 11,82440 10,54810<br />
Malaysia Ringgit MYR 4,86820 4,65509<br />
Mozambique New Metical MZN 34,81500 34,73749<br />
Singapore Dollar SGD 2,11630 2,01929<br />
Tunisia Dinar TND 1,79470 1,71408<br />
United States Dollar USD 1,47210 1,31700<br />
Venezuela Bolívar VEB 3.161,04000 2.017,60000<br />
Land and buildings basically correspond <strong>to</strong> fac<strong>to</strong>ries and offi ces. Land is shown at fair value, based on periodic valuations done at<br />
least every three years by external independent valuers. O<strong>the</strong>r tangible fi xed assets are shown at his<strong>to</strong>rical cost, less depreciation,<br />
including all expenditure directly attributable <strong>to</strong> <strong>the</strong> acquisition of <strong>the</strong> assets.<br />
Subsequent costs are included in <strong>the</strong> cost already booked for <strong>the</strong> asset, or recognised as separate assets, as appropriate, but<br />
only when it is probable that economic benefi ts will accrue <strong>to</strong> <strong>the</strong> company and that <strong>the</strong> cost can be measured reliably. O<strong>the</strong>r<br />
expenditure for repairs and maintenance are recognised as costs in <strong>the</strong> period in which <strong>the</strong>y are incurred.<br />
11<br />
2007 Consolidated and<br />
Individual <strong>Financial</strong> Statments