Notes to the Financial Statements - Efacec
Notes to the Financial Statements - Efacec
Notes to the Financial Statements - Efacec

You also want an ePaper? Increase the reach of your titles
YUMPU automatically turns print PDFs into web optimized ePapers that Google loves.
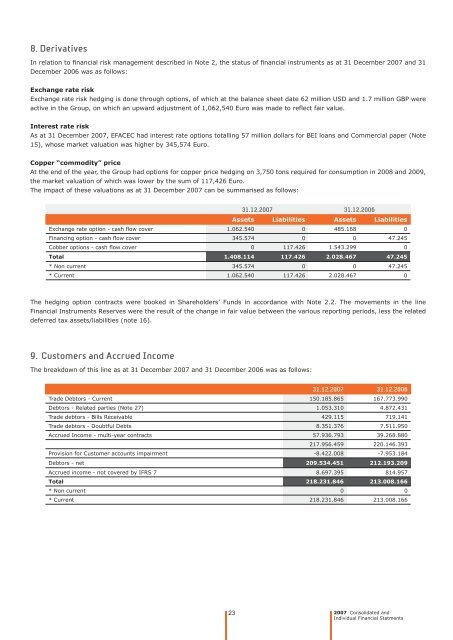
8. Derivatives<br />
In relation <strong>to</strong> fi nancial risk management described in Note 2, <strong>the</strong> status of fi nancial instruments as at 31 December 2007 and 31<br />
December 2006 was as follows:<br />
Exchange rate risk<br />
Exchange rate risk hedging is done through options, of which at <strong>the</strong> balance sheet date 62 million USD and 1.7 million GBP were<br />
active in <strong>the</strong> Group, on which an upward adjustment of 1,062,540 Euro was made <strong>to</strong> refl ect fair value.<br />
Interest rate risk<br />
As at 31 December 2007, EFACEC had interest rate options <strong>to</strong>talling 57 million dollars for BEI loans and Commercial paper (Note<br />
15), whose market valuation was higher by 345,574 Euro.<br />
Copper “commodity” price<br />
At <strong>the</strong> end of <strong>the</strong> year, <strong>the</strong> Group had options for copper price hedging on 3,750 <strong>to</strong>ns required for consumption in 2008 and 2009,<br />
<strong>the</strong> market valuation of which was lower by <strong>the</strong> sum of 117,426 Euro.<br />
The impact of <strong>the</strong>se valuations as at 31 December 2007 can be summarised as follows:<br />
31.12.2007 31.12.2006<br />
Assets Liabilities Assets Liabilities<br />
Exchange rate option - cash fl ow cover 1.062.540 0 485.168 0<br />
Financing option - cash fl ow cover 345.574 0 0 47.245<br />
Cobber options - cash fl ow cover 0 117.426 1.543.299 0<br />
Total 1.408.114 117.426 2.028.467 47.245<br />
* Non current 345.574 0 0 47.245<br />
* Current 1.062.540 117.426 2.028.467 0<br />
The hedging option contracts were booked in Shareholders’ Funds in accordance with Note 2.2. The movements in <strong>the</strong> line<br />
<strong>Financial</strong> Instruments Reserves were <strong>the</strong> result of <strong>the</strong> change in fair value between <strong>the</strong> various reporting periods, less <strong>the</strong> related<br />
deferred tax assets/liabilities (note 16).<br />
9. Cus<strong>to</strong>mers and Accrued Income<br />
The breakdown of this line as at 31 December 2007 and 31 December 2006 was as follows:<br />
31.12.2007 31.12.2006<br />
Trade Deb<strong>to</strong>rs - Current 150.185.865 167.773.990<br />
Deb<strong>to</strong>rs - Related parties (Note 27) 1.053.310 4.872.431<br />
Trade deb<strong>to</strong>rs - Bills Receivable 429.115 719.141<br />
Trade deb<strong>to</strong>rs - Doubtful Debts 8.351.376 7.511.950<br />
Accrued Income - multi-year contracts 57.936.793 39.268.880<br />
217.956.459 220.146.393<br />
Provision for Cus<strong>to</strong>mer accounts impairment -8.422.008 -7.953.184<br />
Deb<strong>to</strong>rs - net 209.534.451 212.193.209<br />
Accrued income - not covered by IFRS 7 8.697.395 814.957<br />
Total 218.231.846 213.008.166<br />
* Non current 0 0<br />
* Current 218.231.846 213.008.166<br />
23<br />
2007 Consolidated and<br />
Individual <strong>Financial</strong> Statments