Notes to the Financial Statements - Efacec
Notes to the Financial Statements - Efacec
Notes to the Financial Statements - Efacec

Create successful ePaper yourself
Turn your PDF publications into a flip-book with our unique Google optimized e-Paper software.
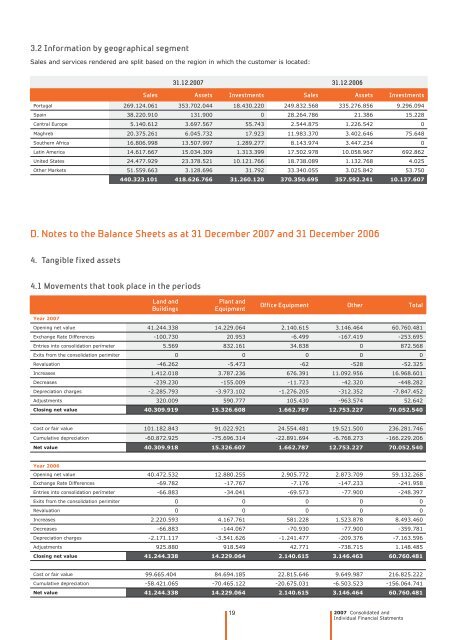
3.2 Information by geographical segment<br />
Sales and services rendered are split based on <strong>the</strong> region in which <strong>the</strong> cus<strong>to</strong>mer is located:<br />
31.12.2007 31.12.2006<br />
Sales Assets Investments Sales Assets Investments<br />
Portugal 269.124.061 353.702.044 18.430.220 249.832.568 335.276.856 9.296.094<br />
Spain 38.220.910 131.900 0 28.264.786 21.386 15.228<br />
Central Europe 5.140.612 3.697.567 55.743 2.544.875 1.226.542 0<br />
Maghreb 20.375.261 6.045.732 17.923 11.983.370 3.402.646 75.648<br />
Sou<strong>the</strong>rn Africa 16.806.998 13.507.997 1.289.277 8.143.974 3.447.234 0<br />
Latin America 14.617.667 15.034.309 1.313.399 17.502.978 10.058.967 692.862<br />
United States 24.477.929 23.378.521 10.121.766 18.738.089 1.132.768 4.025<br />
O<strong>the</strong>r Markets 51.559.663 3.128.696 31.792 33.340.055 3.025.842 53.750<br />
440.323.101 418.626.766 31.260.120 370.350.695 357.592.241 10.137.607<br />
D. <strong>Notes</strong> <strong>to</strong> <strong>the</strong> Balance Sheets as at 31 December 2007 and 31 December 2006<br />
4. Tangible fixed assets<br />
4.1 Movements that <strong>to</strong>ok place in <strong>the</strong> periods<br />
Year 2007<br />
Land and<br />
Buildings<br />
Plant and<br />
Equipment<br />
19<br />
Office Equipment O<strong>the</strong>r Total<br />
Opening net value 41.244.338 14.229.064 2.140.615 3.146.464 60.760.481<br />
Exchange Rate Differences -100.730 20.953 -6.499 -167.419 -253.695<br />
Entries in<strong>to</strong> consolidation perímeter 5.569 832.161 34.838 0 872.568<br />
Exits from <strong>the</strong> consolidation perimiter 0 0 0 0 0<br />
Revaluation -46.262 -5.473 -62 -528 -52.325<br />
Increases 1.412.018 3.787.236 676.391 11.092.956 16.968.601<br />
Decreases -239.230 -155.009 -11.723 -42.320 -448.282<br />
Depreciation charges -2.285.793 -3.973.102 -1.276.205 -312.352 -7.847.452<br />
Adjustments 320.009 590.777 105.430 -963.574 52.642<br />
Closing net value 40.309.919 15.326.608 1.662.787 12.753.227 70.052.540<br />
Cost or fair value 101.182.843 91.022.921 24.554.481 19.521.500 236.281.746<br />
Cumulative depreciation -60.872.925 -75.696.314 -22.891.694 -6.768.273 -166.229.206<br />
Net value 40.309.918 15.326.607 1.662.787 12.753.227 70.052.540<br />
Year 2006<br />
Opening net value 40.472.532 12.880.255 2.905.772 2.873.709 59.132.268<br />
Exchange Rate Differences -69.782 -17.767 -7.176 -147.233 -241.958<br />
Entries in<strong>to</strong> consolidation perímeter -66.883 -34.041 -69.573 -77.900 -248.397<br />
Exits from <strong>the</strong> consolidation perimiter 0 0 0 0 0<br />
Revaluation 0 0 0 0 0<br />
Increases 2.220.593 4.167.761 581.228 1.523.878 8.493.460<br />
Decreases -66.883 -144.067 -70.930 -77.900 -359.781<br />
Depreciation charges -2.171.117 -3.541.626 -1.241.477 -209.376 -7.163.596<br />
Adjustments 925.880 918.549 42.771 -738.715 1.148.485<br />
Closing net value 41.244.338 14.229.064 2.140.615 3.146.463 60.760.481<br />
Cost or fair value 99.665.404. 84.694.185 22.815.646 9.649.987 216.825.222<br />
Cumulative depreciation -58.421.065 -70.465.122 -20.675.031 -6.503.523 -156.064.741<br />
Net value 41.244.338 14.229.064 2.140.615 3.146.464 60.760.481<br />
2007 Consolidated and<br />
Individual <strong>Financial</strong> Statments