Pharmaceuticals Sector - Solvay
Pharmaceuticals Sector - Solvay
Pharmaceuticals Sector - Solvay

Create successful ePaper yourself
Turn your PDF publications into a flip-book with our unique Google optimized e-Paper software.
110<br />
<strong>Solvay</strong> Global Annual Report 2005<br />
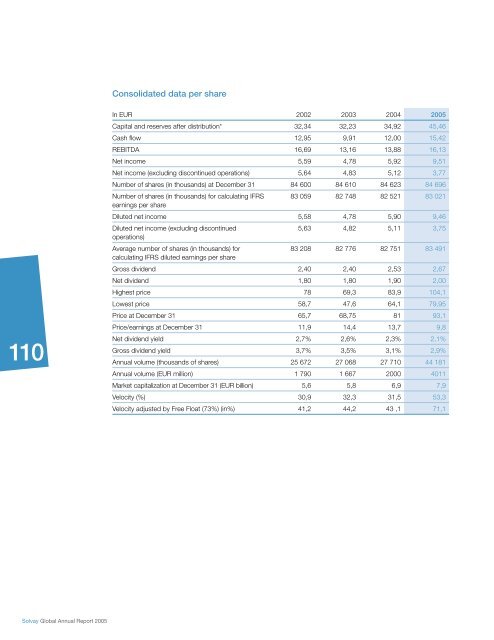
Consolidated data per share<br />
In EUR 2002 2003 2004 2005<br />
Capital and reserves after distribution* 32,34 32,23 34,92 45,46<br />
Cash fl ow 12,95 9,91 12,00 15,42<br />
REBITDA 16,69 13,16 13,88 16,13<br />
Net income 5,59 4,78 5,92 9,51<br />
Net income (excluding discontinued operations) 5,64 4,83 5,12 3,77<br />
Number of shares (in thousands) at December 31 84 600 84 610 84 623 84 696<br />
Number of shares (in thousands) for calculating IFRS<br />
earnings per share<br />
83 059 82 748 82 521 83 021<br />
Diluted net income 5,58 4,78 5,90 9,46<br />
Diluted net income (excluding discontinued<br />
operations)<br />
Average number of shares (in thousands) for<br />
calculating IFRS diluted earnings per share<br />
5,63 4,82 5,11 3,75<br />
83 208 82 776 82 751 83 491<br />
Gross dividend 2,40 2,40 2,53 2,67<br />
Net dividend 1,80 1,80 1,90 2,00<br />
Highest price 78 69,3 83,9 104,1<br />
Lowest price 58,7 47,6 64,1 79,95<br />
Price at December 31 65,7 68,75 81 93,1<br />
Price/earnings at December 31 11,9 14,4 13,7 9,8<br />
Net dividend yield 2,7% 2,6% 2,3% 2,1%<br />
Gross dividend yield 3,7% 3,5% 3,1% 2,9%<br />
Annual volume (thousands of shares) 25 672 27 068 27 710 44 181<br />
Annual volume (EUR million) 1 790 1 667 2000 4011<br />
Market capitalization at December 31 (EUR billion) 5,6 5,8 6,9 7,9<br />
Velocity (%) 30,9 32,3 31,5 53,3<br />
Velocity adjusted by Free Float (73%) (in%) 41,2 44,2 43 ,1 71,1


![PROC.1 [LETTRE] - Solvay](https://img.yumpu.com/16585746/1/184x260/proc1-lettre-solvay.jpg?quality=85)