Pharmaceuticals Sector - Solvay
Pharmaceuticals Sector - Solvay
Pharmaceuticals Sector - Solvay

Create successful ePaper yourself
Turn your PDF publications into a flip-book with our unique Google optimized e-Paper software.
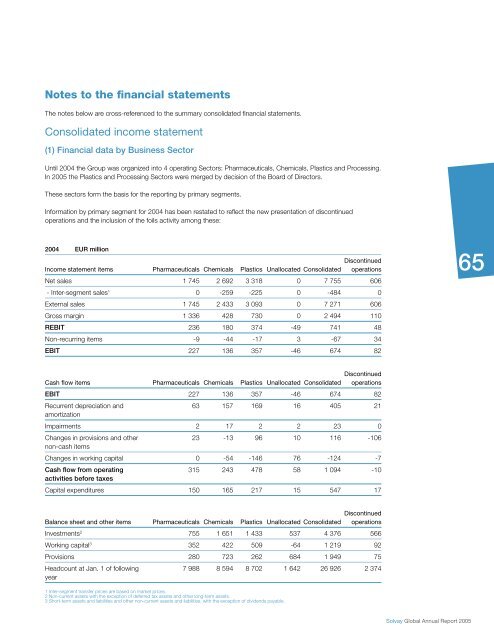
Notes to the fi nancial statements<br />
The notes below are cross-referenced to the summary consolidated fi nancial statements.<br />
Consolidated income statement<br />
(1) Financial data by Business <strong>Sector</strong><br />
Until 2004 the Group was organized into 4 operating <strong>Sector</strong>s: <strong>Pharmaceuticals</strong>, Chemicals, Plastics and Processing.<br />
In 2005 the Plastics and Processing <strong>Sector</strong>s were merged by decision of the Board of Directors.<br />
These sectors form the basis for the reporting by primary segments.<br />
Information by primary segment for 2004 has been restated to refl ect the new presentation of discontinued<br />
operations and the inclusion of the foils activity among these:<br />
2004 EUR million<br />
Income statement items <strong>Pharmaceuticals</strong> Chemicals Plastics Unallocated Consolidated<br />
Discontinued<br />
operations<br />
Net sales 1 745 2 692 3 318 0 7 755 606<br />
- Inter-segment sales1 0 -259 -225 0 -484 0<br />
External sales 1 745 2 433 3 093 0 7 271 606<br />
Gross margin 1 336 428 730 0 2 494 110<br />
REBIT 236 180 374 -49 741 48<br />
Non-recurring items -9 -44 -17 3 -67 34<br />
EBIT 227 136 357 -46 674 82<br />
Cash fl ow items <strong>Pharmaceuticals</strong> Chemicals Plastics Unallocated Consolidated<br />
Discontinued<br />
operations<br />
EBIT 227 136 357 -46 674 82<br />
Recurrent depreciation and<br />
amortization<br />
63 157 169 16 405 21<br />
Impairments 2 17 2 2 23 0<br />
Changes in provisions and other<br />
non-cash items<br />
23 -13 96 10 116 -106<br />
Changes in working capital 0 -54 -146 76 -124 -7<br />
Cash fl ow from operating<br />
activities before taxes<br />
315 243 478 58 1 094 -10<br />
Capital expenditures 150 165 217 15 547 17<br />
Balance sheet and other items <strong>Pharmaceuticals</strong> Chemicals Plastics Unallocated Consolidated<br />
Discontinued<br />
operations<br />
Investments2 755 1 651 1 433 537 4 376 566<br />
Working capital3 352 422 509 -64 1 219 92<br />
Provisions 280 723 262 684 1 949 75<br />
Headcount at Jan. 1 of following<br />
year<br />
7 988 8 594 8 702 1 642 26 926 2 374<br />
1 Inter-segment transfer prices are based on market prices.<br />
2 Non-current assets with the exception of deferred tax assets and other long-term assets.<br />
3 Short-term assets and liabilities and other non-current assets and liabilities, with the exception of dividends payable.<br />
<strong>Solvay</strong> Global Annual Report 2005<br />
65


![PROC.1 [LETTRE] - Solvay](https://img.yumpu.com/16585746/1/184x260/proc1-lettre-solvay.jpg?quality=85)