Pharmaceuticals Sector - Solvay
Pharmaceuticals Sector - Solvay
Pharmaceuticals Sector - Solvay

Create successful ePaper yourself
Turn your PDF publications into a flip-book with our unique Google optimized e-Paper software.
66<br />
<strong>Solvay</strong> Global Annual Report 2005<br />
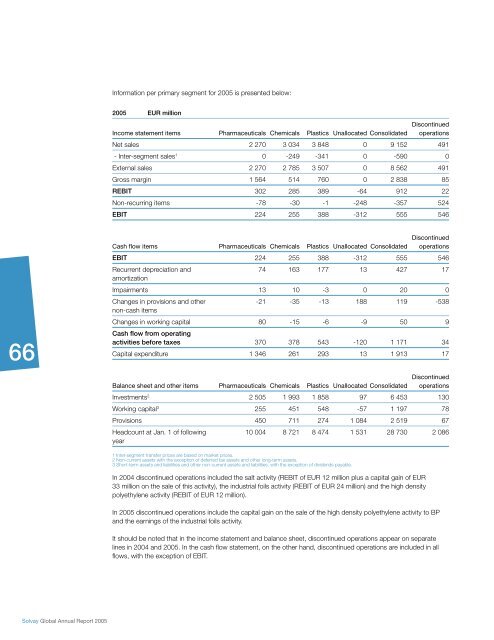
Information per primary segment for 2005 is presented below:<br />
2005 EUR million<br />
Income statement items <strong>Pharmaceuticals</strong> Chemicals Plastics Unallocated Consolidated<br />
Discontinued<br />
operations<br />
Net sales 2 270 3 034 3 848 0 9 152 491<br />
- Inter-segment sales1 0 -249 -341 0 -590 0<br />
External sales 2 270 2 785 3 507 0 8 562 491<br />
Gross margin 1 564 514 760 0 2 838 85<br />
REBIT 302 285 389 -64 912 22<br />
Non-recurring items -78 -30 -1 -248 -357 524<br />
EBIT 224 255 388 -312 555 546<br />
Cash fl ow items <strong>Pharmaceuticals</strong> Chemicals Plastics Unallocated Consolidated<br />
Discontinued<br />
operations<br />
EBIT 224 255 388 -312 555 546<br />
Recurrent depreciation and<br />
amortization<br />
74 163 177 13 427 17<br />
Impairments 13 10 -3 0 20 0<br />
Changes in provisions and other<br />
non-cash items<br />
-21 -35 -13 188 119 -538<br />
Changes in working capital<br />
Cash fl ow from operating<br />
80 -15 -6 -9 50 9<br />
activities before taxes 370 378 543 -120 1 171 34<br />
Capital expenditure 1 346 261 293 13 1 913 17<br />
Balance sheet and other items <strong>Pharmaceuticals</strong> Chemicals Plastics Unallocated Consolidated<br />
Discontinued<br />
operations<br />
Investments2 2 505 1 993 1 858 97 6 453 130<br />
Working capital3 255 451 548 -57 1 197 78<br />
Provisions 450 711 274 1 084 2 519 67<br />
Headcount at Jan. 1 of following<br />
year<br />
10 004 8 721 8 474 1 531 28 730 2 086<br />
1 Inter-segment transfer prices are based on market prices.<br />
2 Non-current assets with the exception of deferred tax assets and other long-term assets.<br />
3 Short-term assets and liabilities and other non-current assets and liabilities, with the exception of dividends payable.<br />
In 2004 discontinued operations included the salt activity (REBIT of EUR 12 million plus a capital gain of EUR<br />
33 million on the sale of this activity), the industrial foils activity (REBIT of EUR 24 million) and the high density<br />
polyethylene activity (REBIT of EUR 12 million).<br />
In 2005 discontinued operations include the capital gain on the sale of the high density polyethylene activity to BP<br />
and the earnings of the industrial foils activity.<br />
It should be noted that in the income statement and balance sheet, discontinued operations appear on separate<br />
lines in 2004 and 2005. In the cash fl ow statement, on the other hand, discontinued operations are included in all<br />
fl ows, with the exception of EBIT.


![PROC.1 [LETTRE] - Solvay](https://img.yumpu.com/16585746/1/184x260/proc1-lettre-solvay.jpg?quality=85)