Appendix 2: Crude Rate Tables for Each Indicator Table A2.6: Crude Numbers for High School Completion Rates (Exclud<strong>in</strong>g Band-Operated Schools) Appendix Table 2.6: Crude Numbers for High School Completion Rates (Exclud<strong>in</strong>g Band-Operated Schools) 1996 1997 1998 214 University of <strong>Manitoba</strong> Crude Rate per 100 Population Number of High School Completion Rates Exclud<strong>in</strong>g Band Crude Rate per 100 Population Number of High School Completion Rates Exclud<strong>in</strong>g Band Crude Rate per 100 Population Number of High School Completion Rates Exclud<strong>in</strong>g Band Income Qu<strong>in</strong>tile Schools Schools Schools Income Not Found 27 68 39.71 39 95 39.71 29 77 41.05 Lowest Rural R1 365 588 62.07 559 837 62.07 548 777 66.79 R2 631 862 73.20 759 1,042 73.20 844 1,128 72.84 R3 692 893 77.49 1,036 1,287 77.49 982 1,214 80.50 R4 766 978 78.32 1,047 1,329 78.32 1,054 1,288 78.78 Highest Rural R5 824 1,057 77.96 1,188 1,452 77.96 1,171 1,451 81.82 Lowest Urban U1 643 1,159 55.48 595 1,116 55.48 731 1,291 53.32 U2 804 1,212 66.34 895 1,315 66.34 921 1,342 68.06 U3 1,018 1,354 75.18 1,226 1,534 75.18 1,190 1,553 79.92 U4 1,490 1,737 85.78 1,545 1,859 85.78 1,606 1,912 83.11 Highest Urban U5 1,756 1,957 89.73 1,850 2,023 89.73 1,799 1,951 91.45 1999 2000 2001 Crude Rate per 100 Population Number of High School Completion Rates Exclud<strong>in</strong>g Band Crude Rate per 100 Population Number of High School Completion Rates Exclud<strong>in</strong>g Band Crude Rate per 100 Population Number of High School Completion Rates Exclud<strong>in</strong>g Band Income Qu<strong>in</strong>tile Schools Schools Schools Income Not Found s s s 11 21 52.38 21 40 52.50 Lowest Rural R1 538 813 66.17 535 887 60.32 589 940 62.66 R2 850 1,081 78.63 922 1,169 78.87 856 1,159 73.86 R3 969 1,220 79.43 954 1,240 76.94 1,010 1,205 83.82 R4 1,065 1,302 81.80 1,028 1,283 80.12 1,129 1,360 83.01 Highest Rural R5 1,258 1,538 81.79 1,355 1,586 85.44 1,152 1,363 84.52 Lowest Urban U1 647 1,178 54.92 718 1,293 55.53 760 1,382 54.99 U2 998 1,423 70.13 981 1,416 69.28 1,051 1,470 71.50 U3 1,169 1,513 77.26 1,295 1,606 80.64 1,331 1,673 79.56 U4 1,634 1,874 87.19 1,709 1,932 88.46 1,723 1,940 88.81 Highest Urban U5 1,862 2,011 92.59 2,107 2,229 94.53 1,968 2,111 93.23 s= suppressed Source: <strong>Manitoba</strong> Centre for <strong>Health</strong> Policy, 2010
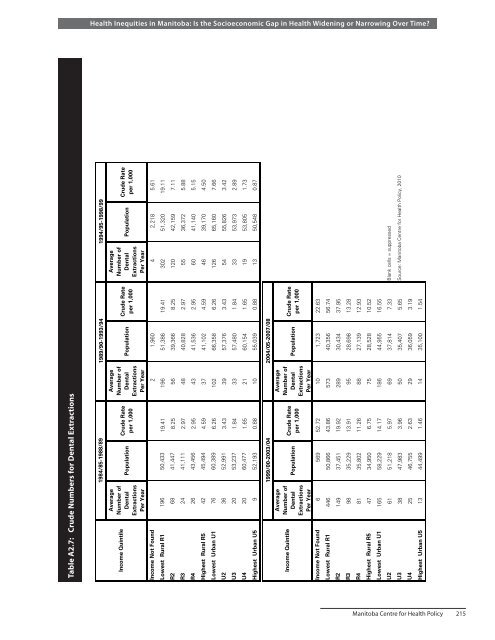
Table A2.7: Crude Numbers for Dental Extractions Appendix Table 2.7: Crude Numbers for Dental Extractions <strong>Health</strong> <strong>Inequities</strong> <strong>in</strong> <strong>Manitoba</strong>: <strong>Is</strong> <strong>the</strong> <strong>Socioeconomic</strong> <strong>Gap</strong> <strong>in</strong> <strong>Health</strong> Widen<strong>in</strong>g or Narrow<strong>in</strong>g Over Time? 1984/85-1988/89 1989/90-1993/94 1994/95-1998/99 Crude Rate per 1,000 Population Average Number of Dental Extractions Per Year Crude Rate per 1,000 Population Average Number of Dental Extractions Per Year Crude Rate per 1,000 Population Average Number of Dental Extractions Per Year Income Qu<strong>in</strong>tile Income Not Found 2 1,960 4 2,218 5.61 Lowest Rural R1 196 50,433 19.41 196 51,386 19.41 302 51,320 19.11 R2 68 41,447 8.25 56 39,366 8.25 120 42,159 7.11 R3 24 41,111 2.97 48 40,828 2.97 55 36,372 5.88 R4 26 43,456 2.95 43 41,536 2.95 60 41,140 5.15 Highest Rural R5 42 45,494 4.59 37 41,102 4.59 46 39,170 4.50 Lowest Urban U1 76 60,389 6.26 102 66,358 6.26 126 65,160 7.66 U2 36 52,991 3.43 39 57,376 3.43 54 55,826 3.42 U3 20 53,237 1.84 33 57,480 1.84 33 53,973 2.89 U4 20 60,477 1.65 21 60,154 1.65 19 53,805 1.73 Highest Urban U5 9 52,193 0.88 10 55,039 0.88 13 50,548 0.87 2004/05-2007/08 1999/00-2003/04 Crude Rate per 1,000 Population Average Number of Dental Extractions Per Year Crude Rate per 1,000 Population Average Number of Dental Extractions Per Year Income Qu<strong>in</strong>tile Income Not Found 6 569 52.72 10 1,723 22.63 Lowest Rural R1 446 50,866 43.86 573 40,356 56.74 R2 149 37,451 19.92 289 30,434 37.95 R3 98 35,229 13.91 95 28,698 13.28 R4 81 35,802 11.26 88 27,139 12.93 Highest Rural R5 47 34,950 6.75 75 28,528 10.52 Lowest Urban U1 165 58,229 14.17 186 44,955 16.55 U2 61 51,218 5.97 69 37,814 7.33 Blank cells = suppressed U3 38 47,983 3.96 50 35,407 5.65 Source: <strong>Manitoba</strong> Centre for <strong>Health</strong> Policy, 2010 U4 25 46,755 2.63 29 36,059 3.19 Highest Urban U5 13 44,499 1.46 14 35,100 1.54 <strong>Manitoba</strong> Centre for <strong>Health</strong> Policy 215
- Page 1 and 2:
HEALTH INEQUITIES IN MANITOBA: Is t
- Page 3 and 4:
About the Manitoba Centre For Healt
- Page 5 and 6:
Dr. Patricia Martens acknowledges t
- Page 7 and 8:
Key findings: High School Completio
- Page 9 and 10:
List of Figures Figure 1.1 Distribu
- Page 11 and 12:
Figure 4.27 Adjusted Lorenz Curve f
- Page 13 and 14:
Figure 6.15 Hospitalization Due to
- Page 15 and 16:
List of Tables Table E.1 Changes in
- Page 17 and 18:
Figure A3.6 Adjusted Lorenz Curve f
- Page 19 and 20:
Executive Summary Health status and
- Page 21 and 22:
(derived from Table E.1’s columns
- Page 23 and 24:
Table E.1: Continued Indicator RURA
- Page 25 and 26:
Table E.1: Continued Indicator RURA
- Page 27 and 28:
Table Table E.2: E.2: Is Is the the
- Page 29 and 30:
This page edited May 18, 2011. Tabl
- Page 31 and 32:
References Commission on Social Det
- Page 33 and 34:
Health Inequities in Manitoba: Is t
- Page 35 and 36:
Health Inequities in Manitoba: Is t
- Page 37 and 38:
Health Inequities in Manitoba: Is t
- Page 39 and 40:
Health Inequities in Manitoba: Is t
- Page 41 and 42:
Health Inequities in Manitoba: Is t
- Page 43 and 44:
Health Inequities in Manitoba: Is t
- Page 45 and 46:
Health Inequities in Manitoba: Is t
- Page 47 and 48:
Health Inequities in Manitoba: Is t
- Page 49 and 50:
Table 2.1: Neighbourhood Income Qui
- Page 51 and 52:
Table 2.3: Neighbourhood Table 2.3:
- Page 53 and 54:
Health Inequities in Manitoba: Is t
- Page 55 and 56:
Health Inequities in Manitoba: Is t
- Page 57 and 58:
Health Inequities in Manitoba: Is t
- Page 59 and 60:
Figure 3.2: Premature Mortality Rat
- Page 61 and 62:
Health Inequities in Manitoba: Is t
- Page 63 and 64:
Health Inequities in Manitoba: Is t
- Page 65 and 66:
Health Inequities in Manitoba: Is t
- Page 67 and 68:
Figure 3.10: Potential Years of Lif
- Page 69 and 70:
Cumulative Percent of Potential Yea
- Page 71 and 72:
Health Inequities in Manitoba: Is t
- Page 73 and 74:
Health Inequities in Manitoba: Is t
- Page 75 and 76:
Figure 3.18: Under Five Mortality R
- Page 77 and 78:
Health Inequities in Manitoba: Is t
- Page 79 and 80:
Health Inequities in Manitoba: Is t
- Page 81 and 82:
Health Inequities in Manitoba: Is t
- Page 83 and 84:
Figure 4.2: Teen Pregnancy Rates Ov
- Page 85 and 86:
Health Inequities in Manitoba: Is t
- Page 87 and 88:
Health Inequities in Manitoba: Is t
- Page 89 and 90:
Health Inequities in Manitoba: Is t
- Page 91 and 92:
Figure 4.10: High School Completion
- Page 93 and 94:
Health Inequities in Manitoba: Is t
- Page 95 and 96:
Health Inequities in Manitoba: Is t
- Page 97 and 98:
Health Inequities in Manitoba: Is t
- Page 99 and 100:
Figure 4.18: Dental Extraction Rate
- Page 101 and 102:
Health Inequities in Manitoba: Is t
- Page 103 and 104:
Health Inequities in Manitoba: Is t
- Page 105 and 106:
Health Inequities in Manitoba: Is t
- Page 107 and 108:
Figure 4.26: Breastfeeding Initiati
- Page 109 and 110:
Health Inequities in Manitoba: Is t
- Page 111 and 112:
References: Health Inequities in Ma
- Page 113 and 114:
Health Inequities in Manitoba: Is t
- Page 115 and 116:
Health Inequities in Manitoba: Is t
- Page 117 and 118:
Figure 5.2: Diabetes Prevalence Ove
- Page 119 and 120:
Health Inequities in Manitoba: Is t
- Page 121 and 122:
Health Inequities in Manitoba: Is t
- Page 123 and 124:
Health Inequities in Manitoba: Is t
- Page 125 and 126:
Figure 5.10: Amputations Among Figu
- Page 127 and 128:
Health Inequities in Manitoba: Is t
- Page 129 and 130:
Health Inequities in Manitoba: Is t
- Page 131 and 132:
Health Inequities in Manitoba: Is t
- Page 133 and 134:
Figure 5.18: Ischemic Heart Disease
- Page 135 and 136:
Health Inequities in Manitoba: Is t
- Page 137 and 138:
Health Inequities in Manitoba: Is t
- Page 139 and 140:
Health Inequities in Manitoba: Is t
- Page 141 and 142:
Figure 5.26: Multiple Sclerosis Pre
- Page 143 and 144:
Health Inequities in Manitoba: Is t
- Page 145 and 146:
References: Health Inequities in Ma
- Page 147 and 148:
Health Inequities in Manitoba: Is t
- Page 149 and 150:
Health Inequities in Manitoba: Is t
- Page 151 and 152:
Figure 6.2: Continuity of Care Prev
- Page 153 and 154:
Health Inequities in Manitoba: Is t
- Page 155 and 156:
Health Inequities in Manitoba: Is t
- Page 157 and 158:
Health Inequities in Manitoba: Is t
- Page 159 and 160:
Figure 6.10: Hospitalization Due to
- Page 161 and 162:
Health Inequities in Manitoba: Is t
- Page 163 and 164:
Health Inequities in Manitoba: Is t
- Page 165 and 166:
Health Inequities in Manitoba: Is t
- Page 167 and 168:
CONFIDENTIAL -- NOT FOR DISTRIBUTIO
- Page 169 and 170:
Health Inequities in Manitoba: Is t
- Page 171 and 172:
Health Inequities in Manitoba: Is t
- Page 173 and 174:
Health Inequities in Manitoba: Is t
- Page 175 and 176:
Figure 7.2: Prevalence of Cumulativ
- Page 177 and 178:
Health Inequities in Manitoba: Is t
- Page 179 and 180:
Dementia Health Inequities in Manit
- Page 181 and 182:
Health Inequities in Manitoba: Is t
- Page 183 and 184:
Figure 7.10: Dementia Prevalence Ov
- Page 185 and 186:
Health Inequities in Manitoba: Is t
- Page 187 and 188:
Health Inequities in Manitoba: Is t
- Page 189 and 190:
Health Inequities in Manitoba: Is t
- Page 191 and 192:
Figure 7.18: Prevalence of Complete
- Page 193 and 194:
Health Inequities in Manitoba: Is t
- Page 195 and 196: Reference Health Inequities in Mani
- Page 197 and 198: Health Inequities in Manitoba: Is t
- Page 199 and 200: Health Inequities in Manitoba: Is t
- Page 201 and 202: Figure 8.2: Post-AMI Care: Beta-Blo
- Page 203 and 204: Health Inequities in Manitoba: Is t
- Page 205 and 206: Reference Health Inequities in Mani
- Page 207 and 208: Health Inequities in Manitoba: Is t
- Page 209 and 210: Table 9.1: Continued Indicator RURA
- Page 211 and 212: Table 9.1: Continued Health Inequit
- Page 213 and 214: Health Inequities in Manitoba: Is t
- Page 215 and 216: Health Inequities in Manitoba: Is t
- Page 217 and 218: Health Inequities in Manitoba: Is t
- Page 219 and 220: Health Inequities in Manitoba: Is t
- Page 221 and 222: Health Inequities in Manitoba: Is t
- Page 223 and 224: Health Inequities in Manitoba: Is t
- Page 225 and 226: Health Inequities in Manitoba: Is t
- Page 227 and 228: Health Inequities in Manitoba: Is t
- Page 229 and 230: Health Inequities in Manitoba: Is t
- Page 231 and 232: Health Inequities in Manitoba: Is t
- Page 233 and 234: Health Inequities in Manitoba: Is t
- Page 235 and 236: Health Inequities in Manitoba: Is t
- Page 237 and 238: Health Inequities in Manitoba: Is t
- Page 239 and 240: Health Inequities in Manitoba: Is t
- Page 241 and 242: Health Inequities in Manitoba: Is t
- Page 243 and 244: Table A2.3: Crude Numbers of Mortal
- Page 245: Table A2.5: Crude Numbers for High
- Page 249 and 250: Health Inequities in Manitoba: Is t
- Page 251 and 252: Table A2.11: Crude Numbers for Isch
- Page 253 and 254: Table A2.13: Crude Numbers for Cont
- Page 255 and 256: CONFIDENTIAL ‐‐ NOT FOR DISTRIB
- Page 257 and 258: Table A2.17: Crude Numbers for Cumu
- Page 259 and 260: Health Inequities in Manitoba: Is t
- Page 261 and 262: Health Inequities in Manitoba: Is t
- Page 263 and 264: Figure A3.2: High School Appendix C
- Page 265 and 266: Health Inequities in Manitoba: Is t
- Page 267 and 268: Health Inequities in Manitoba: Is t
- Page 269: Copies of MCHP publications are ava