

Health Inequities in Manitoba: Is the Socioeconomic Gap
Health Inequities in Manitoba: Is the Socioeconomic Gap
Health Inequities in Manitoba: Is the Socioeconomic Gap

Create successful ePaper yourself
Turn your PDF publications into a flip-book with our unique Google optimized e-Paper software.
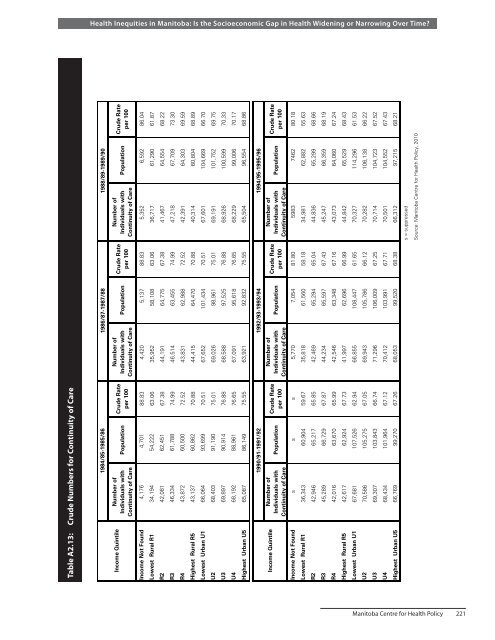
Table A2.13: Crude Numbers for Cont<strong>in</strong>uity of Care<br />
Appendix Table 2.13: Crude Numbers for Cont<strong>in</strong>uity of Care<br />
<strong>Health</strong> <strong>Inequities</strong> <strong>in</strong> <strong>Manitoba</strong>: <strong>Is</strong> <strong>the</strong> <strong>Socioeconomic</strong> <strong>Gap</strong> <strong>in</strong> <strong>Health</strong> Widen<strong>in</strong>g or Narrow<strong>in</strong>g Over Time?<br />
1984/85-1985/86 1986/87-1987/88 1988/89-1989/90<br />
Crude Rate<br />
per 100<br />
Population<br />
Number of<br />
Individuals with<br />
Cont<strong>in</strong>uity of Care<br />
Crude Rate<br />
per 100<br />
Population<br />
Number of<br />
Individuals with<br />
Cont<strong>in</strong>uity of Care<br />
Crude Rate<br />
per 100<br />
Population<br />
Number of<br />
Individuals with<br />
Cont<strong>in</strong>uity of Care<br />
Income Qu<strong>in</strong>tile<br />
Income Not Found 4,176 4,701 88.83 4,420 5,137 88.83 5,352 6,592 86.04<br />
Lowest Rural R1 34,194 54,222 63.06 35,952 58,108 63.06 36,717 61,290 61.87<br />
R2 42,081 62,451 67.38 44,191 64,775 67.38 41,467 64,554 68.22<br />
R3 46,334 61,788 74.99 46,514 63,455 74.99 47,218 67,709 73.30<br />
R4 43,872 60,500 72.52 43,831 62,988 72.52 42,391 64,303 69.59<br />
Highest Rural R5 43,137 60,862 70.88 44,415 64,470 70.88 40,314 60,804 68.89<br />
Lowest Urban U1 66,064 93,699 70.51 67,652 101,434 70.51 67,601 104,669 66.70<br />
U2 68,403 91,190 75.01 69,026 98,961 75.01 69,191 101,752 69.75<br />
U3 69,897 90,914 76.88 68,588 97,525 76.88 68,926 100,599 70.33<br />
U4 68,192 88,961 76.65 67,091 95,618 76.65 68,229 99,006 70.17<br />
Highest Urban U5 65,087 86,149 75.55 63,921 92,832 75.55 65,504 96,554 68.86<br />
1990/91-1991/92 1992/93-1993/94<br />
1994/95-1995/96<br />
Income Qu<strong>in</strong>tile Number of<br />
Number of<br />
Number of<br />
Crude Rate<br />
Crude Rate<br />
Crude Rate<br />
Individuals with Population<br />
Individuals with Population<br />
Individuals with Population<br />
per 100<br />
per 100<br />
per 100<br />
Cont<strong>in</strong>uity of Care<br />
Cont<strong>in</strong>uity of Care<br />
Cont<strong>in</strong>uity of Care<br />
Income Not Found s s s 5,770 7,054 81.80 5983 7462 80.18<br />
Lowest Rural R1 36,343 60,904 59.67 35,818 61,560 58.18 34,981 62,882 55.63<br />
R2 42,946 65,217 65.85 42,469 65,294 65.04 44,836 65,299 68.66<br />
R3 45,289 66,729 67.87 44,234 65,597 67.43 45,247 66,359 68.19<br />
R4 42,016 63,670 65.99 42,546 63,348 67.16 43,073 64,060 67.24<br />
Highest Rural R5 42,617 62,924 67.73 41,997 62,696 66.99 44,842 65,529 68.43<br />
Lowest Urban U1 67,681 107,526 62.94 66,855 108,447 61.65 70,327 114,296 61.53<br />
U2 70,586 105,275 67.05 69,943 105,786 66.12 70,282 106,138 66.22<br />
U3 69,307 103,843 66.74 71,296 106,009 67.25 70,714 104,723 67.52<br />
U4 68,434 101,964 67.12 70,412 103,991 67.71 70,501 104,552 67.43<br />
Highest Urban U5 66,769 99,270 67.26 68,053 99,520 68.38 66,312 97,215 68.21<br />
s = suppressed<br />
Source: <strong>Manitoba</strong> Centre for <strong>Health</strong> Policy, 2010<br />
<strong>Manitoba</strong> Centre for <strong>Health</strong> Policy 221