Health Inequities in Manitoba: Is the Socioeconomic Gap
Health Inequities in Manitoba: Is the Socioeconomic Gap
Health Inequities in Manitoba: Is the Socioeconomic Gap
You also want an ePaper? Increase the reach of your titles
YUMPU automatically turns print PDFs into web optimized ePapers that Google loves.
Chapter 2: A Description of <strong>the</strong> Neighbourhood Income Qu<strong>in</strong>tiles us<strong>in</strong>g Census Data<br />
16 University of <strong>Manitoba</strong><br />
suppressed or zero. Of those, 31 DAs had less than 40 residents. Income measures are not reported <strong>in</strong><br />
<strong>the</strong> census if <strong>the</strong> population size of <strong>the</strong> DA is fewer than 250 residents or 40 households. If a DA conta<strong>in</strong>s<br />
at least 40 non–<strong>in</strong>stitutionalized people, but less than 250 people, o<strong>the</strong>r census characteristics will be<br />
reported but <strong>the</strong> DA will have an average household <strong>in</strong>come of zero. After imputation, only six DAs<br />
were categorized as <strong>in</strong>come “not found” (NF) with a population of 830 <strong>in</strong>dividuals. In <strong>the</strong> Repository<br />
data, <strong>the</strong> number of people <strong>in</strong> <strong>the</strong> NF group for <strong>the</strong> 2006 <strong>Manitoba</strong> population is slightly higher than<br />
<strong>the</strong> NF group for <strong>the</strong> 2006 census. If an <strong>in</strong>dividual’s postal code is not <strong>in</strong>cluded <strong>in</strong> <strong>the</strong> PCCF, <strong>the</strong>n <strong>the</strong>ir<br />
postal code cannot be l<strong>in</strong>ked to a DA and thus <strong>the</strong> neighbourhood <strong>in</strong>come qu<strong>in</strong>tile of <strong>the</strong> <strong>in</strong>dividual<br />
rema<strong>in</strong>s NF. So, <strong>in</strong> o<strong>the</strong>r chapters a higher percentage of <strong>the</strong> population has been categorized as not<br />
found. Ano<strong>the</strong>r limitation of <strong>the</strong> method used to assign neighbourhood <strong>in</strong>come qu<strong>in</strong>tiles to DAs was<br />
that <strong>the</strong> census population distribution across neighbourhood <strong>in</strong>come qu<strong>in</strong>tiles was not as equal as<br />
when <strong>the</strong> Repository population is assigned neighbourhood <strong>in</strong>come qu<strong>in</strong>tiles, particularly <strong>in</strong> <strong>the</strong> rural<br />
DAs. One ma<strong>in</strong> difference between <strong>the</strong> two methods is that assignment of <strong>the</strong> Repository population<br />
to neighbourhood <strong>in</strong>come qu<strong>in</strong>tiles excludes DAs where <strong>the</strong> majority (greater than 90%) of residents<br />
reside <strong>in</strong> <strong>in</strong>stitutions such as personal care homes or prisons. Also, <strong>the</strong> smaller range of neighbourhood<br />
<strong>in</strong>come values with<strong>in</strong> rural areas could make subtle differences <strong>in</strong> population distributions more<br />
apparent <strong>in</strong> <strong>the</strong> census population. However, despite <strong>the</strong> neighbourhood <strong>in</strong>come qu<strong>in</strong>tile distribution<br />
for <strong>the</strong> rural census DAs not be<strong>in</strong>g exactly 20% <strong>in</strong> each, this l<strong>in</strong>k<strong>in</strong>g technique was <strong>the</strong> best approach<br />
given <strong>the</strong> limited l<strong>in</strong>kage possibilities of <strong>the</strong> census to o<strong>the</strong>r data sources.<br />
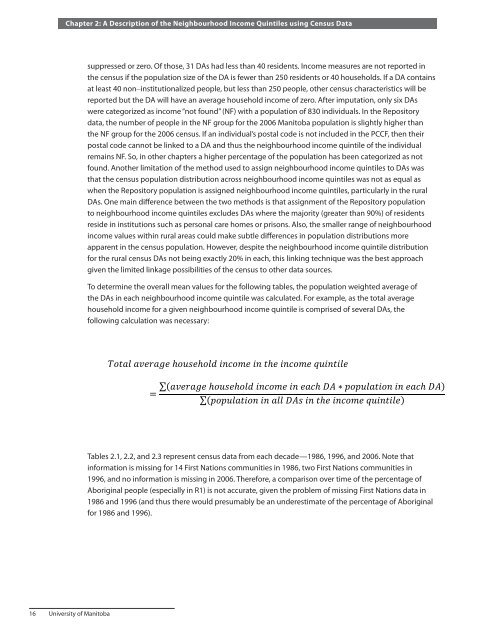
To determ<strong>in</strong>e <strong>the</strong> overall mean values for <strong>the</strong> follow<strong>in</strong>g tables, <strong>the</strong> population weighted average of<br />
<strong>the</strong> DAs <strong>in</strong> each neighbourhood <strong>in</strong>come qu<strong>in</strong>tile was calculated. For example, as <strong>the</strong> total average<br />
household <strong>in</strong>come for a given neighbourhood <strong>in</strong>come qu<strong>in</strong>tile is comprised of several DAs, <strong>the</strong><br />
follow<strong>in</strong>g calculation was necessary:<br />
�����������������������������������������������������<br />
�<br />
������������������������������������� � ����������������������<br />
�����������������������������������������������<br />
Tables 2.1, 2.2, and 2.3 represent census data from each decade—1986, 1996, and 2006. Note that<br />
<strong>in</strong>formation is miss<strong>in</strong>g for 14 First Nations communities <strong>in</strong> 1986, two First Nations communities <strong>in</strong><br />
1996, and no <strong>in</strong>formation is miss<strong>in</strong>g <strong>in</strong> 2006. Therefore, a comparison over time of <strong>the</strong> percentage of<br />
Aborig<strong>in</strong>al people (especially <strong>in</strong> R1) is not accurate, given <strong>the</strong> problem of miss<strong>in</strong>g First Nations data <strong>in</strong><br />
1986 and 1996 (and thus <strong>the</strong>re would presumably be an underestimate of <strong>the</strong> percentage of Aborig<strong>in</strong>al<br />
for 1986 and 1996).


