- Page 2: IN PURSUIT OF THE GENE
- Page 5 and 6: To my wife, Ann Hochschild, whose u
- Page 8 and 9: ILLUSTRATIONS Charles Darwin and Fr
- Page 10 and 11: PREFACE ¨ SCIENCE IS FUNDAMENTALLY
- Page 12 and 13: PREFACE © xi diana University, and
- Page 14 and 15: PREFACE © xiii each of the more co
- Page 16 and 17: CHAPTER 1 Viva Pangenesis ¨ IN THE
- Page 18 and 19: VIVA PANGENESIS © 3 ber of small d
- Page 20 and 21: VIVA PANGENESIS © 5 sumption that
- Page 22 and 23: VIVA PANGENESIS © 7 university car
- Page 24 and 25: VIVA PANGENESIS © 9 banish obsessi
- Page 26 and 27: VIVA PANGENESIS © 11 Military Coll
- Page 28 and 29: VIVA PANGENESIS © 13 tions of pang
- Page 30 and 31: VIVA PANGENESIS © 15 Still playing
- Page 32 and 33: VIVA PANGENESIS © 17 Although Galt
- Page 34 and 35: VIVA PANGENESIS © 19 and Louisa tr
- Page 36 and 37: VIVA PANGENESIS © 21 tion]. What l
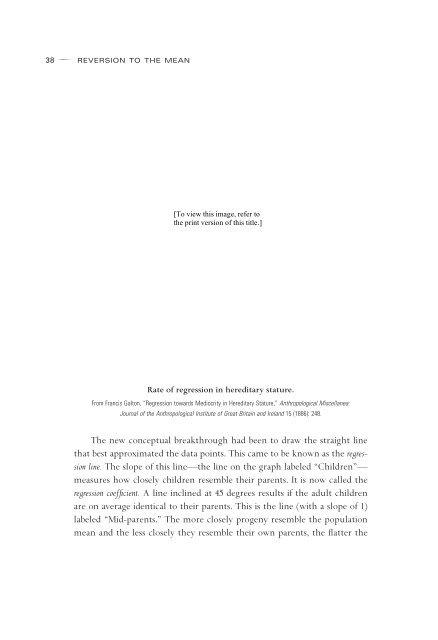
- Page 38 and 39: CHAPTER 2 Reversion to the Mean ¨
- Page 40 and 41: REVERSION TO THE MEAN © 25 a price
- Page 42 and 43: REVERSION TO THE MEAN © 27 the pop
- Page 44 and 45: REVERSION TO THE MEAN © 29 In fact
- Page 46 and 47: REVERSION TO THE MEAN © 31 jects h
- Page 48 and 49: [To view this image, refer to the p
- Page 50 and 51: [To view this image, refer to the p
- Page 54 and 55: [To view this image, refer to the p
- Page 56 and 57: REVERSION TO THE MEAN © 41 self ha
- Page 58 and 59: REVERSION TO THE MEAN © 43 cape re
- Page 60 and 61: CHAPTER 3 Galton’s Disciples ¨ I
- Page 62 and 63: GALTON’S DISCIPLES © 47 In the s
- Page 64 and 65: GALTON’S DISCIPLES © 49 fection
- Page 66 and 67: GALTON’S DISCIPLES © 51 treme va
- Page 68 and 69: GALTON’S DISCIPLES © 53 popular
- Page 70 and 71: GALTON’S DISCIPLES © 55 species
- Page 72 and 73: GALTON’S DISCIPLES © 57 see the
- Page 74 and 75: GALTON’S DISCIPLES © 59 ety meet
- Page 76 and 77: GALTON’S DISCIPLES © 61 that no
- Page 78 and 79: GALTON’S DISCIPLES © 63 lished r
- Page 80 and 81: GALTON’S DISCIPLES © 65 lights m
- Page 83 and 84: [To view this image, refer to the p
- Page 85 and 86: 70 ¨ PANGENES he took a position a
- Page 87 and 88: 72 ¨ PANGENES In the following yea
- Page 89 and 90: 74 ¨ PANGENES his own. In the plac
- Page 91 and 92: 76 ¨ PANGENES transported from the
- Page 93 and 94: 78 ¨ PANGENES sized: The first he
- Page 95 and 96: 80 ¨ PANGENES tical study of the l
- Page 97 and 98: 82 ¨ PANGENES ber,” which posite
- Page 99 and 100: 84 ¨ PANGENES peared in April 1900
- Page 101 and 102: [To view this image, refer to the p
- Page 103 and 104:
88 ¨ MENDEL younger Mendel having
- Page 105 and 106:
90 ¨ MENDEL lower grades. The phys
- Page 107 and 108:
92 ¨ MENDEL brids, following the i
- Page 109 and 110:
94 ¨ MENDEL invisible, and the sam
- Page 111 and 112:
96 ¨ MENDEL A less sinister interp
- Page 113 and 114:
98 ¨ MENDEL way had their position
- Page 115 and 116:
100 ¨ MENDEL In the same paper, Me
- Page 117 and 118:
102 ¨ MENDEL sequestration if Mend
- Page 119 and 120:
[To view this image, refer to the p
- Page 121 and 122:
106 ¨ REDISCOVERY planning to publ
- Page 123 and 124:
108 ¨ REDISCOVERY which each pange
- Page 125 and 126:
110 ¨ REDISCOVERY installment of h
- Page 127 and 128:
112 ¨ REDISCOVERY one closely rese
- Page 129 and 130:
114 ¨ REDISCOVERY That winter, in
- Page 131 and 132:
116 ¨ REDISCOVERY only had Weldon
- Page 133 and 134:
[To view this image, refer to the p
- Page 135 and 136:
120 ¨ MENDEL WARS Conference on Hy
- Page 137 and 138:
122 ¨ MENDEL WARS patches of color
- Page 139 and 140:
124 ¨ MENDEL WARS The final exchan
- Page 141 and 142:
126 ¨ MENDEL WARS [To view this im
- Page 143 and 144:
128 ¨ MENDEL WARS ing, and that wa
- Page 145 and 146:
130 ¨ MENDEL WARS ready proven him
- Page 147 and 148:
132 ¨ MENDEL WARS fused his offer,
- Page 149 and 150:
134 ¨ MENDEL WARS included a large
- Page 151 and 152:
136 ¨ MENDEL WARS mous studbook, w
- Page 153 and 154:
138 ¨ MENDEL WARS soon as he had f
- Page 155 and 156:
140 ¨ MENDEL WARS his research, Hu
- Page 157 and 158:
142 ¨ MENDEL WARS In February, Wel
- Page 159 and 160:
[To view this image, refer to the p
- Page 161 and 162:
146 ¨ CELL BIOLOGY and Schleiden h
- Page 163 and 164:
148 ¨ CELL BIOLOGY [To view this i
- Page 165 and 166:
150 ¨ CELL BIOLOGY first noticed b
- Page 167 and 168:
152 ¨ CELL BIOLOGY generation. Thi
- Page 169 and 170:
154 ¨ CELL BIOLOGY tween nuclear d
- Page 171 and 172:
156 ¨ CELL BIOLOGY been working fo
- Page 173 and 174:
158 ¨ CELL BIOLOGY Although he mad
- Page 175 and 176:
160 ¨ CELL BIOLOGY [To view this i
- Page 177 and 178:
162 ¨ CELL BIOLOGY The clear depic
- Page 179 and 180:
[To view this image, refer to the p
- Page 181 and 182:
166 ¨ SEX CHROMOSOMES were two kin
- Page 183 and 184:
168 ¨ SEX CHROMOSOMES dicated that
- Page 185 and 186:
170 ¨ SEX CHROMOSOMES to all previ
- Page 187 and 188:
172 ¨ SEX CHROMOSOMES and set them
- Page 189 and 190:
174 ¨ SEX CHROMOSOMES bryology had
- Page 191 and 192:
176 ¨ SEX CHROMOSOMES loid set of
- Page 193 and 194:
178 ¨ SEX CHROMOSOMES next summer
- Page 195 and 196:
180 ¨ SEX CHROMOSOMES first explai
- Page 197 and 198:
182 ¨ SEX CHROMOSOMES somes, givin
- Page 199 and 200:
[To view this image, refer to the p
- Page 201 and 202:
186 ¨ THE FLY ROOM sity worked tog
- Page 203 and 204:
188 ¨ THE FLY ROOM world-renowned
- Page 205 and 206:
190 ¨ THE FLY ROOM ress in the Stu
- Page 207 and 208:
192 ¨ THE FLY ROOM near one anothe
- Page 209 and 210:
194 ¨ THE FLY ROOM would often lea
- Page 211 and 212:
196 ¨ THE FLY ROOM when he took Mo
- Page 213 and 214:
198 ¨ THE FLY ROOM more convenient
- Page 215 and 216:
200 ¨ THE FLY ROOM most extreme ca
- Page 217 and 218:
202 ¨ THE FLY ROOM to the extent t
- Page 219 and 220:
204 ¨ THE FLY ROOM responsible for
- Page 221:
206 ¨ THE FLY ROOM but theoretical
- Page 224 and 225:
CHAPTER 11 Oenothera Reconsidered
- Page 226 and 227:
OENOTHERA RECONSIDERED © 211 winge
- Page 228 and 229:
OENOTHERA RECONSIDERED © 213 succe
- Page 230 and 231:
OENOTHERA RECONSIDERED © 215 tatio
- Page 232 and 233:
OENOTHERA RECONSIDERED © 217 compl
- Page 234 and 235:
OENOTHERA RECONSIDERED © 219 outcr
- Page 236 and 237:
CHAPTER 12 X-Rays ¨ WITH THE RESOL
- Page 238 and 239:
X-RAYS © 223 through, due to the i
- Page 240 and 241:
X-RAYS © 225 Suddenly Muller jumpe
- Page 242 and 243:
X-RAYS © 227 C � B experiments a
- Page 244 and 245:
X-RAYS © 229 Bateson’s plenary a
- Page 246 and 247:
X-RAYS © 231 Bateson’s famous fo
- Page 248 and 249:
X-RAYS © 233 Cramped, noisy, overh
- Page 250 and 251:
X-RAYS © 235 ing. “It was funny
- Page 252 and 253:
X-RAYS © 237 birth of the baby, wh
- Page 254 and 255:
X-RAYS © 239 spontaneous lethals (
- Page 256 and 257:
X-RAYS © 241 the Fifth Internation
- Page 258 and 259:
CHAPTER 13 Triumph of the Modern Ge
- Page 260 and 261:
TRIUMPH OF THE MODERN GENE © 245 D
- Page 262 and 263:
TRIUMPH OF THE MODERN GENE © 247 l
- Page 264 and 265:
TRIUMPH OF THE MODERN GENE © 249 w
- Page 266 and 267:
TRIUMPH OF THE MODERN GENE © 251 t
- Page 268 and 269:
+ + B f B f + B B fu + B B + f + TR
- Page 270 and 271:
TRIUMPH OF THE MODERN GENE © 255 f
- Page 272 and 273:
TRIUMPH OF THE MODERN GENE © 257 t
- Page 274 and 275:
TRIUMPH OF THE MODERN GENE © 259 F
- Page 276 and 277:
TRIUMPH OF THE MODERN GENE © 261 t
- Page 278 and 279:
TRIUMPH OF THE MODERN GENE © 263 O
- Page 280 and 281:
TRIUMPH OF THE MODERN GENE © 265 m
- Page 282 and 283:
TRIUMPH OF THE MODERN GENE © 267 f
- Page 284 and 285:
TRIUMPH OF THE MODERN GENE © 269 p
- Page 286 and 287:
TRIUMPH OF THE MODERN GENE © 271 p
- Page 288 and 289:
TRIUMPH OF THE MODERN GENE © 273 s
- Page 290 and 291:
TRIUMPH OF THE MODERN GENE © 275 f
- Page 292 and 293:
EPILOGUE ¨ IN FEBRUARY 1944, Oswal
- Page 294 and 295:
locks were laid down that accounted
- Page 296 and 297:
EPILOGUE © 281 In November 1951, W
- Page 298 and 299:
EPILOGUE © 283 The discovery in 19
- Page 300 and 301:
EPILOGUE © 285 characterization of
- Page 302 and 303:
EPILOGUE © 287 master gene on chro
- Page 304 and 305:
EPILOGUE © 289 the genome could be
- Page 306:
NOTES ACKNOWLEDGMENTS INDEX
- Page 309 and 310:
294 ¨ NOTES TO PAGES 4-8 help in p
- Page 311 and 312:
296 ¨ NOTES TO PAGES 19-28 58. Let
- Page 313 and 314:
298 ¨ NOTES TO PAGES 36-42 35. Let
- Page 315 and 316:
300 ¨ NOTES TO PAGES 50-58 F.R.S.
- Page 317 and 318:
302 ¨ NOTES TO PAGES 70-81 2. Ibid
- Page 319 and 320:
304 ¨ NOTES TO PAGES 84-89 27. Ibi
- Page 321 and 322:
306 ¨ NOTES TO PAGES 93-95 29. The
- Page 323 and 324:
308 ¨ NOTES TO PAGES 106-111 (1900
- Page 325 and 326:
310 ¨ NOTES TO PAGES 114-120 24. I
- Page 327 and 328:
312 ¨ NOTES TO PAGES 125-132 15. A
- Page 329 and 330:
314 ¨ NOTES TO PAGES 137-146 55. W
- Page 331 and 332:
316 ¨ NOTES TO PAGES 150-153 15. E
- Page 333 and 334:
318 ¨ NOTES TO PAGES 157-160 38. M
- Page 335 and 336:
320 ¨ NOTES TO PAGES 167-171 6. Ib
- Page 337 and 338:
322 ¨ NOTES TO PAGES 173-176 33. A
- Page 339 and 340:
324 ¨ NOTES TO PAGES 182-186 of Tw
- Page 341 and 342:
326 ¨ NOTES TO PAGES 190-192 multi
- Page 343 and 344:
328 ¨ NOTES TO PAGES 195-200 31. M
- Page 345 and 346:
330 ¨ NOTES TO PAGES 202-210 Franc
- Page 347 and 348:
332 ¨ NOTES TO PAGES 213-215 13. I
- Page 349 and 350:
334 ¨ NOTES TO PAGES 218-222 28. B
- Page 351 and 352:
336 ¨ NOTES TO PAGES 225-228 14. T
- Page 353 and 354:
338 ¨ NOTES TO PAGES 235-239 “Ob
- Page 355 and 356:
340 ¨ NOTES TO PAGES 245-254 9. H.
- Page 357 and 358:
342 ¨ NOTES TO PAGES 258-262 51. J
- Page 359 and 360:
344 ¨ NOTES TO PAGES 266-272 84. S
- Page 361 and 362:
346 ¨ NOTES TO PAGES 276-283 123.
- Page 363 and 364:
348 ¨ NOTES TO PAGES 288-289 Becau
- Page 365 and 366:
350 ¨ ACKNOWLEDGMENTS also deeply
- Page 368 and 369:
“Accessory Chromosome, The: Sex D
- Page 370 and 371:
ell curve. See normal distribution
- Page 372 and 373:
34, 50, 60-61; and study of plant m
- Page 374 and 375:
“fly room.” See Columbia Univer
- Page 376 and 377:
ics; evolution; gemmules; genes; hy
- Page 378 and 379:
y, 306n37; early life of, 87-88; fu
- Page 380 and 381:
222-223; Russian geneticists and, 2
- Page 382 and 383:
studies of, 79-85; Wichura and, 100
- Page 384 and 385:
Stalin, Joseph, 258, 262, 267, 269,