

annual report - FIAT SpA
annual report - FIAT SpA
annual report - FIAT SpA

Create successful ePaper yourself
Turn your PDF publications into a flip-book with our unique Google optimized e-Paper software.
REPORT ON OPERATIONS<br />
HIGHLIGHTS<br />
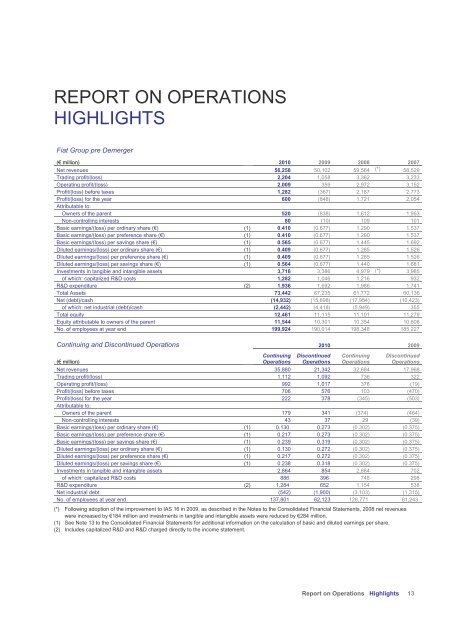
Fiat Group pre Demerger<br />
(€ million) 2010 2009 2008 2007<br />
Net revenues 56,258 50,102 59,564 (*) 58,529<br />
Trading profit/(loss) 2,204 1,058 3,362 3,233<br />
Operating profit/(loss) 2,009 359 2,972 3,152<br />
Profit/(loss) before taxes 1,282 (367) 2,187 2,773<br />
Profit/(loss) for the year 600 (848) 1,721 2,054<br />
Attributable to:<br />
Owners of the parent 520 (838) 1,612 1,953<br />
Non-controlling interests 80 (10) 109 101<br />
Basic earnings/(loss) per ordinary share (€) (1) 0.410 (0.677) 1.290 1.537<br />
Basic earnings/(loss) per preference share (€) (1) 0.410 (0.677) 1.290 1.537<br />
Basic earnings/(loss) per savings share (€) (1) 0.565 (0.677) 1.445 1.692<br />
Diluted earnings/(loss) per ordinary share (€) (1) 0.409 (0.677) 1.285 1.526<br />
Diluted earnings/(loss) per preference share (€) (1) 0.409 (0.677) 1.285 1.526<br />
Diluted earnings/(loss) per savings share (€) (1) 0.564 (0.677) 1.440 1.681<br />
Investments in tangible and intangible assets 3,718 3,386 4,979 (*) 3,985<br />
of which: capitalized R&D costs 1,282 1,046 1,216 932<br />
R&D expenditure (2) 1,936 1,692 1,986 1,741<br />
Total Assets 73,442 67,235 61,772 60,136<br />
Net (debt)/cash (14,932) (15,898) (17,954) (10,423)<br />
of which: net industrial (debt)/cash (2,442) (4,418) (5,949) 355<br />
Total equity 12,461 11,115 11,101 11,279<br />
Equity attributable to owners of the parent 11,544 10,301 10,354 10,606<br />
No. of employees at year end 199,924 190,014 198,348 185,227<br />
Continuing and Discontinued Operations 2010 2009<br />
(€ million)<br />
Continuing<br />
Operations<br />
Discontinued<br />
Operations<br />
Continuing<br />
Operations<br />
Discontinued<br />
Operations<br />
Net revenues 35,880 21,342 32,684 17,968<br />
Trading profit/(loss) 1,112 1,092 736 322<br />
Operating profit/(loss) 992 1,017 378 (19)<br />
Profit/(loss) before taxes 706 576 103 (470)<br />
Profit/(loss) for the year<br />
Attributable to:<br />
222 378 (345) (503)<br />
Owners of the parent 179 341 (374) (464)<br />
Non-controlling interests 43 37 29 (39)<br />
Basic earnings/(loss) per ordinary share (€) (1) 0.130 0.273 (0.302) (0.375)<br />
Basic earnings/(loss) per preference share (€) (1) 0.217 0.273 (0.302) (0.375)<br />
Basic earnings/(loss) per savings share (€) (1) 0.239 0.319 (0.302) (0.375)<br />
Diluted earnings/(loss) per ordinary share (€) (1) 0.130 0.272 (0.302) (0.375)<br />
Diluted earnings/(loss) per preference share (€) (1) 0.217 0.272 (0.302) (0.375)<br />
Diluted earnings/(loss) per savings share (€) (1) 0.238 0.318 (0.302) (0.375)<br />
Investments in tangible and intangible assets 2,864 854 2,684 702<br />
of which: capitalized R&D costs 886 396 748 298<br />
R&D expenditure (2) 1,284 652 1,154 538<br />
Net industrial debt (542) (1,900) (3,103) (1,315)<br />
No. of employees at year end 137,801 62,123 128,771 61,243<br />
(*) Following adoption of the improvement to IAS 16 in 2009, as described in the Notes to the Consolidated Financial Statements, 2008 net revenues<br />
were increased by €184 million and investments in tangible and intangible assets were reduced by €284 million.<br />
(1) See Note 13 to the Consolidated Financial Statements for additional information on the calculation of basic and diluted earnings per share.<br />
(2) Includes capitalized R&D and R&D charged directly to the income statement.<br />
Report on Operations Highlights 13


