2daFORROS 2008 - Sitio Web Restringido - Gobierno de Jalisco ...
2daFORROS 2008 - Sitio Web Restringido - Gobierno de Jalisco ...
2daFORROS 2008 - Sitio Web Restringido - Gobierno de Jalisco ...

You also want an ePaper? Increase the reach of your titles
YUMPU automatically turns print PDFs into web optimized ePapers that Google loves.
70<br />
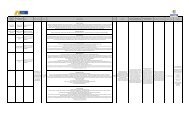
Tabla 2.25. Población con Vulnerabilida<strong>de</strong>s Sociales en la Región, por Municipios. Año<br />
2005.<br />
Municipio<br />
Niños <strong>de</strong> 0 a 4 años<br />
1/<br />
Niños<br />
% <strong>de</strong> la<br />
población<br />
total <strong>de</strong>l<br />
municipio<br />
Población <strong>de</strong> 15 años y<br />
más que no<br />
concluyeron la primaria<br />
1/<br />
Personas<br />
% <strong>de</strong> la<br />
población 15<br />
y más años Personas<br />
<strong>de</strong>l<br />
municipio<br />
Personas con<br />
discapacidad<br />
2/<br />
% <strong>de</strong> la<br />
población<br />
total <strong>de</strong>l<br />
municipio<br />
Personas <strong>de</strong> 60 y<br />
más años<br />
1/<br />
Personas<br />
% <strong>de</strong> la<br />
población<br />
total <strong>de</strong>l<br />
municipio<br />
Martes 8 <strong>de</strong> mayo <strong>de</strong> 2012. Número 45. Sección IX<br />
Población indígena<br />
1/<br />
Personas<br />
% <strong>de</strong> la<br />
población<br />
total <strong>de</strong>l<br />
municipio<br />
Autlán <strong>de</strong><br />
Navarro<br />
4,890 9.18% 6,528 17.82 1,529 2.87 5,455 10.24 397 0.75<br />
Casimiro<br />
Castillo<br />
1,804 9.54% 2,913 22.83 605 3.20 2,010 10.63 56 0.30<br />
Cihuatlán 3,178 10.51% 3,846 19.38 717 2.37 2,350 7.77 519 1.72<br />
Cuautitlán<br />
<strong>de</strong> García<br />
Barragán<br />
1,880 11.46% 2,912 28.39 390 2.38 1,851 11.28 226 1.38<br />
La Huerta 2,023 10.03% 3,096 23.64 484 2.40 2,105 10.44 130 0.64<br />
Villa<br />
Purificación<br />
1,050 9.57% 2,321 32.46 403 3.67 1,555 14.17 25 0.23<br />
Total en la<br />
Región 8<br />
14,825 9.89% 21,616 21.67 4,128 2.75 15,326 10.22 1,353 0.90<br />
Fuente: 1/ INEGI. II Conteo <strong>de</strong> Población y Vivienda, 2005., 2/ INEGI. XII Censo General <strong>de</strong> Población y Vivienda, 2000. (Nota: Este<br />
capítulo no fue incluido en el II Conteo <strong>de</strong> Población y Vivienda, 2005)<br />
Municipio<br />
Autlán <strong>de</strong><br />
Navarro<br />
Casimiro<br />
Castillo<br />
Tabla 2.26. Población con vulnerabilida<strong>de</strong>s sociales en la<br />
Región, por municipios. Año 2010<br />
Niños <strong>de</strong> 0 a 4<br />
años 1/<br />
Población <strong>de</strong> 15<br />
años y más que<br />
no concluyeron la<br />
primaria 1/<br />
Personas con<br />
discapacidad<br />
2/<br />
Personas <strong>de</strong> 60 y<br />
más años<br />
1/<br />
Niño<br />
s<br />
% <strong>de</strong> la<br />
població<br />
n total<br />
<strong>de</strong>l<br />
municipi<br />
o<br />
Persona<br />
s<br />
% <strong>de</strong> la<br />
població<br />
n 15 y<br />
Persona<br />
más<br />
s<br />
años <strong>de</strong>l<br />
municipi<br />
o<br />
% <strong>de</strong> la<br />
població<br />
n total<br />
<strong>de</strong>l<br />
municipi<br />
o<br />
Persona<br />
s<br />
% <strong>de</strong> la<br />
població<br />
n total<br />
<strong>de</strong>l<br />
municipi<br />
o<br />
Persona<br />
s<br />
Población<br />
indígena<br />
1/<br />
% <strong>de</strong> la<br />
població<br />
n total<br />
<strong>de</strong>l<br />
municipi<br />
o<br />
5494 9.54 6339 15.41 2794 4.85 6270 10.89 592 1.069<br />
2048 9.54 2962 19.63 1081 5.03 2537 11.81 34 0.17<br />
Cihuatlán 4143 10.62 4694 17.66 1870 4.79 3374 8.65 416 1.15<br />
Cuautitlán<br />
<strong>de</strong> García<br />
Barragán<br />
1776 10.25 2820 24.59 673 3.89 2030 11.72 150 0.92<br />
Huerta, La 2361 10.08 3273 20.13 1474 6.29 2668 11.39 67 0.30