2daFORROS 2008 - Sitio Web Restringido - Gobierno de Jalisco ...
2daFORROS 2008 - Sitio Web Restringido - Gobierno de Jalisco ...
2daFORROS 2008 - Sitio Web Restringido - Gobierno de Jalisco ...

You also want an ePaper? Increase the reach of your titles
YUMPU automatically turns print PDFs into web optimized ePapers that Google loves.
80<br />
2.3.3.2. Cobertura<br />
La cobertura educativa es <strong>de</strong>finida como los alumnos atendidos por el sistema<br />
educativo en relación a la población que representa la edad en cursar el nivel <strong>de</strong><br />
formación correspondiente.<br />
La región Costa Sur ha registrado un crecimiento <strong>de</strong>sequilibrado en este sentido<br />
mientras unos niveles registran avances significativos otros lo hacen con menor grado.<br />
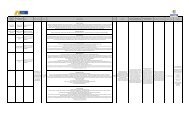
Tabla 2.37. Cobertura y variación porcentual regional y estatal por nivel educativo<br />
Nivel<br />
Educativo<br />
Ciclo escolar<br />
2006-2007 %<br />
Ciclo escolar<br />
2010-2011 %<br />
Martes 8 <strong>de</strong> mayo <strong>de</strong> 2012. Número 45. Sección IX<br />
80<br />
Variación<br />
porcentual<br />
regional<br />
Estatal Regional Estatal Regional<br />
Preescolar 75.95 83.15 78.34 91.78 8.63 2.39<br />
Primaria 91.91 100.00 101.65 100.00 0.00 9.74<br />
Variación<br />
porcentual<br />
estatal<br />
Secundaria 88.79 91.75 90.81 95.55 3.79 2.02<br />
Media<br />
superior<br />
53.55 71.70 59.51 68.79 -2.91 5.96<br />
Fuente: Secretaría Educación <strong>Jalisco</strong>. Dirección <strong>de</strong> Estadística y Sistemas <strong>de</strong> Información.<br />
La cobertura regional representa algunas variaciones entre los ciclo analizados, sin<br />
embargo en casi todos los niveles y modalida<strong>de</strong>s su ten<strong>de</strong>ncia es creciente<br />
comparando los ciclos 2006-2007 y 2010-2011, se pue<strong>de</strong> apreciar que los niveles <strong>de</strong><br />
preescolar y secundaria registraron la mayor expansión con 8.63 y 3.79 puntos<br />
porcentuales respectivamente.<br />
Municipio<br />
Tabla 2.38. Cobertura estatal, regional, municipal y por nivel educativo<br />
Preescolar Primaria Secundaria Media superior<br />
Ciclo<br />
escolar<br />
2006-<br />
2007<br />
Ciclo<br />
escolar<br />
2010-<br />
2011<br />
Ciclo<br />
escolar<br />
2006-<br />
2007<br />
Ciclo<br />
escolar<br />
2010-<br />
2011<br />
Ciclo<br />
escola<br />
r<br />
2006-<br />
2007<br />
Autlán De Navarro 87.88% 91.09% 98.93% 100.00% 90.99<br />
%<br />
Casimiro Castillo 79.78% 89.09% 100.00% 100.00% 90.65<br />
%<br />
Cihuatlán 92.20% 100.00% 100.00% 100.00% 100.00<br />
%<br />
Cuautitlán De 80.50% 81.00% 94.99% 98.91% 82.36<br />
García Barragán<br />
%<br />
La Huerta 77.41% 93.60% 100.00% 100.00% 94.61<br />
%<br />
Villa Purificación 57.63% 80.49% 95.87% 100.00% 78.60<br />
%<br />
Cobertura Regional 83.15% 91.78% 100.00% 100.00% 91.75<br />
%<br />
Cobertura Estatal 75.95% 78.34% 91.91% 101.65% 88.79<br />
%<br />
Ciclo<br />
escola<br />
r<br />
2010-<br />
2011<br />
89.89<br />
%<br />
97.54<br />
%<br />
100.00<br />
%<br />
86.49<br />
%<br />
100.00<br />
%<br />
85.35<br />
%<br />
95.55<br />
%<br />
90.81<br />
%<br />
Ciclo<br />
escola<br />
r<br />
2006-<br />
2007<br />
100.00<br />
%<br />
100.00<br />
%<br />
90.25<br />
%<br />
Ciclo<br />
escola<br />
r<br />
2010-<br />
2011<br />
57.43<br />
%<br />
67.40<br />
%<br />
100.00<br />
%<br />
0.00% 65.56<br />
%<br />
0.00% 55.57<br />
%<br />
0.00% 67.81<br />
%<br />
71.70 68.79<br />
% %<br />
53.55 59.51<br />
% %