2daFORROS 2008 - Sitio Web Restringido - Gobierno de Jalisco ...
2daFORROS 2008 - Sitio Web Restringido - Gobierno de Jalisco ...
2daFORROS 2008 - Sitio Web Restringido - Gobierno de Jalisco ...

You also want an ePaper? Increase the reach of your titles
YUMPU automatically turns print PDFs into web optimized ePapers that Google loves.
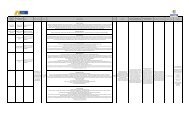
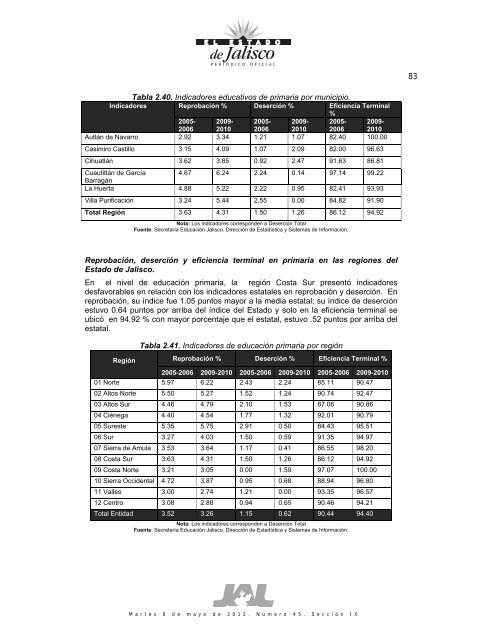
Tabla 2.40. Indicadores educativos <strong>de</strong> primaria por municipio.<br />
Indicadores Reprobación % Deserción % Eficiencia Terminal<br />
%<br />
2005- 2009- 2005- 2009- 2005- 2009-<br />
2006 2010 2006 2010 2006 2010<br />
Autlán <strong>de</strong> Navarro 2.92 3.34 1.21 1.07 82.40 100.00<br />
Casimiro Castillo 3.15 4.09 1.07 2.09 82.00 96.63<br />
Cihuatlán 3.62 3.85 0.92 2.47 91.63 86.81<br />
Cuautitlán <strong>de</strong> García<br />
Barragán<br />
4.67 6.24 2.24 0.14 97.14 99.22<br />
La Huerta 4.88 5.22 2.22 0.95 82.41 93.93<br />
Villa Purificación 3.24 5.44 2.55 0.00 84.82 91.90<br />
Total Región 3.63 4.31 1.50 1.26 86.12 94.92<br />
Nota: Los indicadores correspon<strong>de</strong>n a Deserción Total<br />
Fuente: Secretaría Educación <strong>Jalisco</strong>. Dirección <strong>de</strong> Estadística y Sistemas <strong>de</strong> Información.<br />
Reprobación, <strong>de</strong>serción y eficiencia terminal en primaria en las regiones <strong>de</strong>l<br />
Estado <strong>de</strong> <strong>Jalisco</strong>.<br />
En el nivel <strong>de</strong> educación primaria, la región Costa Sur presentó indicadores<br />
<strong>de</strong>sfavorables en relación con los indicadores estatales en reprobación y <strong>de</strong>serción. En<br />
reprobación, su índice fue 1.05 puntos mayor a la media estatal; su índice <strong>de</strong> <strong>de</strong>serción<br />
estuvo 0.64 puntos por arriba <strong>de</strong>l índice <strong>de</strong>l Estado y solo en la eficiencia terminal se<br />
ubicó en 94.92 % con mayor porcentaje que el estatal, estuvo .52 puntos por arriba <strong>de</strong>l<br />
estatal.<br />
Región<br />
Tabla 2.41. Indicadores <strong>de</strong> educación primaria por región<br />
Reprobación % Deserción % Eficiencia Terminal %<br />
2005-2006 2009-2010 2005-2006 2009-2010 2005-2006 2009-2010<br />
01 Norte 5.97 6.22 2.43 2.24 85.11 90.47<br />
02 Altos Norte 5.50 5.27 1.52 1.24 90.74 92.47<br />
03 Altos Sur 4.46 4.79 2.10 1.53 87.06 90.86<br />
04 Ciénega 4.40 4.54 1.77 1.32 92.01 90.79<br />
05 Sureste 5.35 5.75 2.91 0.50 84.43 95.51<br />
06 Sur 3.27 4.03 1.50 0.59 91.35 94.97<br />
07 Sierra <strong>de</strong> Amula 3.53 3.64 1.17 0.41 86.55 98.20<br />
08 Costa Sur 3.63 4.31 1.50 1.26 86.12 94.92<br />
09 Costa Norte 3.21 3.05 0.00 1.59 97.07 100.00<br />
10 Sierra Occi<strong>de</strong>ntal 4.72 3.87 0.95 0.68 88.94 96.80<br />
11 Valles 3.00 2.74 1.21 0.00 93.35 96.57<br />
12 Centro 3.08 2.88 0.94 0.65 90.46 94.21<br />
Total Entidad 3.52 3.26 1.15 0.62 90.44 94.40<br />
Nota: Los indicadores correspon<strong>de</strong>n a Deserción Total<br />
Fuente: Secretaría Educación <strong>Jalisco</strong>. Dirección <strong>de</strong> Estadística y Sistemas <strong>de</strong> Información.<br />
83<br />
Martes 8 <strong>de</strong> mayo <strong>de</strong> 2012. Número 45. Sección IX<br />
83