Capítulo 4 EVOLUCIÓN DE LA ACTIVIDAD COMERCIAL - Pateco
Capítulo 4 EVOLUCIÓN DE LA ACTIVIDAD COMERCIAL - Pateco
Capítulo 4 EVOLUCIÓN DE LA ACTIVIDAD COMERCIAL - Pateco

You also want an ePaper? Increase the reach of your titles
YUMPU automatically turns print PDFs into web optimized ePapers that Google loves.
CAPÍTULO 7. <strong>LA</strong> DISTRIBUCIÓN <strong>COMERCIAL</strong> EN EL ENTORNO INTERNACIONAL<br />
presas del sector. Holanda alcanza en este caso el<br />
92 por 100 de cuota de mercado, mientras que en<br />
Polonia la cuota de mercado de las 5 primeras<br />
empresas supone únicamente el 19 por 100.<br />
7.1.5. Participación extranjera en la<br />
distribución comercial de los países de la<br />
Unión Europea<br />
CUADRO 7.6<br />
PROPORCIÓN <strong>DE</strong> FACTURACIÓN <strong>DE</strong>L COMERCIO AL<br />
POR MENOR <strong>DE</strong> EMPRESAS EXTRANJERAS<br />
(Porcentaje))<br />
País / Año 2003 2004 2005 2006 2007<br />
Alemania ................... – – – 3,9 –<br />
Austria ....................... 16,4 – – – –<br />
Bulgaria ..................... 9,8 10,8 10,4 15,0 –<br />
Chipre........................ – – – – –<br />
Dinamarca ................. – – – – –<br />
Eslovaquia................. 29,4 33,3 36,7 34,0 30,5<br />
Eslovenia................... 14,6 16,0 – 17,2 –<br />
España...................... 15,5 15,8 13,0 15,8 –<br />
Estonia ...................... 36,2 40,4 43,7 38,6 –<br />
Finlandia.................... 8,0 8,5 8,4 – –<br />
Francia ...................... 8,0 8,4 9,1 9,5 –<br />
Hungría...................... 29,2 30,0 32,6 35,4 –<br />
Italia........................... 8,2 11,9 11,3 11,7 13,4<br />
Letonia....................... 26,3 31,8 30,5 33,7 35,2<br />
Lituania...................... 12,8 14,3 15,1 15,9 –<br />
Países Bajos ............. 7,4 9,8 10,1 – –<br />
Polonia ...................... – – – – 39,4<br />
Portugal ..................... 10,1 9,6 11,6 12,9 –<br />
Reino Unido............... – – – 15,7 –<br />
República Checa ....... 33,6 36,0 37,5 40,2 –<br />
Rumania .................... 9,5 14,7 14,6 19,3 35,5<br />
Suecia ....................... 9,8 12,2 14,1 15,9 11,0<br />
Fuente: Eurostat.<br />
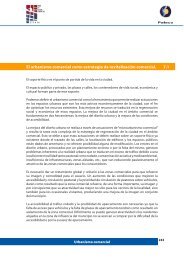
Según los datos de la Oficina Estadística de la<br />
Unión Europea (Eurostat. Structural business statistics/Foreign<br />
control of enterprises), en el año 2006,<br />
que es el último del cual se dispone información<br />
de la mayor parte de los países, España era el país<br />
con mayor proporción de facturación de empresas<br />
extranjeras en su distribución comercial (División<br />
52 NACE Rev. 1.1, comercio al por menor) entre<br />
las 5 principales economías de la UE, con una participación<br />
del 15,8 por 100, como se puede observar<br />
en el Gráfico 7.3.<br />
Sólo el Reino Unido, con un 15,7 por 100 de<br />
participación extranjera, se encuentra a un nivel<br />
semejante al de España, mientras que las cifras de<br />
Italia (11,7 por 100), Francia (9,5 por 100) y especialmente<br />
Alemania (3,9 por 100) se sitúan claramente<br />
por debajo.<br />
En el Cuadro 7.6 aparece, para 22 países de la<br />
Unión Europea, la proporción de facturación del<br />
comercio al por menor realizada por empresas<br />
extranjeras cada año en el periodo 2003 a 2007. <br />
16,0<br />
GRÁFICO 7.3<br />
PORCENTAJES <strong>DE</strong> FACTURACIÓN <strong>DE</strong>L COMERCIO AL POR MENOR POR EMPRESAS EXTRANJERAS<br />
(NACE Rev. 1.1 div. 52)<br />
14,0<br />
12,0<br />
10,0<br />
8,0<br />
15,8<br />
15,7<br />
6,0<br />
11,7<br />
9,5<br />
4,0<br />
2,0<br />
3,9<br />
0,0<br />
España Alemania Francia Italia Reino Unido<br />
Fuente: Eurostat.<br />
Distribución comercial<br />
BOLETÍN ECONÓMICO <strong>DE</strong> ICE Nº 2993<br />
141<br />
<strong>DE</strong>L 16 AL 31 <strong>DE</strong> JULIO <strong>DE</strong> 2010