Comparaisons multidimensionnelles de bien-être et de pauvreté ...
Comparaisons multidimensionnelles de bien-être et de pauvreté ...
Comparaisons multidimensionnelles de bien-être et de pauvreté ...
You also want an ePaper? Increase the reach of your titles
YUMPU automatically turns print PDFs into web optimized ePapers that Google loves.
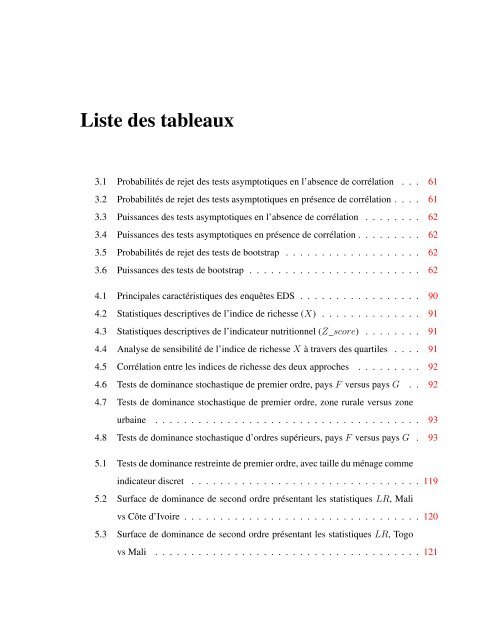
Liste <strong>de</strong>s tableaux3.1 Probabilités <strong>de</strong> rej<strong>et</strong> <strong>de</strong>s tests asymptotiques en l’absence <strong>de</strong> corrélation . . . 613.2 Probabilités <strong>de</strong> rej<strong>et</strong> <strong>de</strong>s tests asymptotiques en présence <strong>de</strong> corrélation . . . . 613.3 Puissances <strong>de</strong>s tests asymptotiques en l’absence <strong>de</strong> corrélation . . . . . . . . 623.4 Puissances <strong>de</strong>s tests asymptotiques en présence <strong>de</strong> corrélation . . . . . . . . . 623.5 Probabilités <strong>de</strong> rej<strong>et</strong> <strong>de</strong>s tests <strong>de</strong> bootstrap . . . . . . . . . . . . . . . . . . . 623.6 Puissances <strong>de</strong>s tests <strong>de</strong> bootstrap . . . . . . . . . . . . . . . . . . . . . . . . 624.1 Principales caractéristiques <strong>de</strong>s enquêtes EDS . . . . . . . . . . . . . . . . . 904.2 Statistiques <strong>de</strong>scriptives <strong>de</strong> l’indice <strong>de</strong> richesse (X) . . . . . . . . . . . . . . 914.3 Statistiques <strong>de</strong>scriptives <strong>de</strong> l’indicateur nutritionnel (Z_score) . . . . . . . . 914.4 Analyse <strong>de</strong> sensibilité <strong>de</strong> l’indice <strong>de</strong> richesse X à travers <strong>de</strong>s quartiles . . . . 914.5 Corrélation entre les indices <strong>de</strong> richesse <strong>de</strong>s <strong>de</strong>ux approches . . . . . . . . . 924.6 Tests <strong>de</strong> dominance stochastique <strong>de</strong> premier ordre, pays F versus pays G . . 924.7 Tests <strong>de</strong> dominance stochastique <strong>de</strong> premier ordre, zone rurale versus zoneurbaine . . . . . . . . . . . . . . . . . . . . . . . . . . . . . . . . . . . . . 934.8 Tests <strong>de</strong> dominance stochastique d’ordres supérieurs, pays F versus pays G . 935.1 Tests <strong>de</strong> dominance restreinte <strong>de</strong> premier ordre, avec taille du ménage commeindicateur discr<strong>et</strong> . . . . . . . . . . . . . . . . . . . . . . . . . . . . . . . . 1195.2 Surface <strong>de</strong> dominance <strong>de</strong> second ordre présentant les statistiques LR, Malivs Côte d’Ivoire . . . . . . . . . . . . . . . . . . . . . . . . . . . . . . . . . 1205.3 Surface <strong>de</strong> dominance <strong>de</strong> second ordre présentant les statistiques LR, Togovs Mali . . . . . . . . . . . . . . . . . . . . . . . . . . . . . . . . . . . . . 121


