Custo-efetividade do tratamento da infecção pelo vírus da hepatite ...
Custo-efetividade do tratamento da infecção pelo vírus da hepatite ...
Custo-efetividade do tratamento da infecção pelo vírus da hepatite ...

Create successful ePaper yourself
Turn your PDF publications into a flip-book with our unique Google optimized e-Paper software.
50<br />
transplante são baixas, geran<strong>do</strong> uma permanência eleva<strong>da</strong> <strong>do</strong>s pacientes no esta<strong>do</strong> “diálise”,<br />
onde a taxa de mortali<strong>da</strong>de também é eleva<strong>da</strong>. Desta forma, os custos “salvos” com<br />
<strong>tratamento</strong> <strong>da</strong> <strong>infecção</strong> <strong>pelo</strong> VHC, decorrentes <strong>da</strong> redução de complicações no póstransplante,<br />
perdem muito significa<strong>do</strong>. Por isso, foi necessário incorporar ao modelo anterior<br />
os esta<strong>do</strong>s de saúde prévios ao transplante renal, incorporan<strong>do</strong> seus custos na coorte trata<strong>da</strong>.<br />
Assim, obtivemos um custo médio <strong>do</strong> <strong>tratamento</strong> para realização <strong>da</strong> análise de impacto<br />
orçamentário.<br />
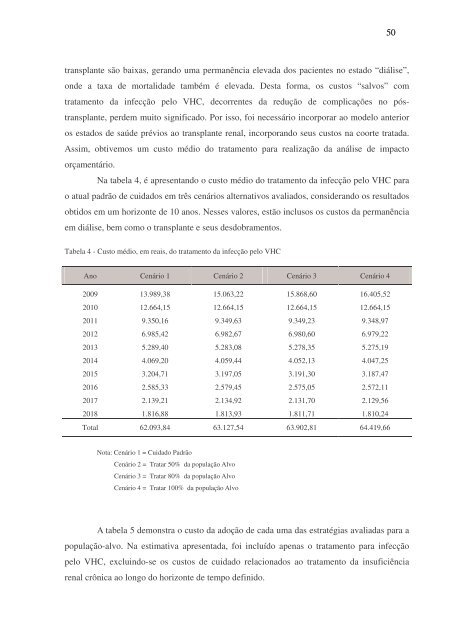
Na tabela 4, é apresentan<strong>do</strong> o custo médio <strong>do</strong> <strong>tratamento</strong> <strong>da</strong> <strong>infecção</strong> <strong>pelo</strong> VHC para<br />
o atual padrão de cui<strong>da</strong><strong>do</strong>s em três cenários alternativos avalia<strong>do</strong>s, consideran<strong>do</strong> os resulta<strong>do</strong>s<br />
obti<strong>do</strong>s em um horizonte de 10 anos. Nesses valores, estão inclusos os custos <strong>da</strong> permanência<br />
em diálise, bem como o transplante e seus des<strong>do</strong>bramentos.<br />
Tabela 4 - <strong>Custo</strong> médio, em reais, <strong>do</strong> <strong>tratamento</strong> <strong>da</strong> <strong>infecção</strong> <strong>pelo</strong> VHC<br />
Ano Cenário 1 Cenário 2 Cenário 3 Cenário 4<br />
2009 13.989,38 15.063,22 15.868,60 16.405,52<br />
2010 12.664,15 12.664,15 12.664,15 12.664,15<br />
2011 9.350,16 9.349,63 9.349,23 9.348,97<br />
2012 6.985,42 6.982,67 6.980,60 6.979,22<br />
2013 5.289,40 5.283,08 5.278,35 5.275,19<br />
2014 4.069,20 4.059,44 4.052,13 4.047,25<br />
2015 3.204,71 3.197,05 3.191,30 3.187,47<br />
2016 2.585,33 2.579,45 2.575,05 2.572,11<br />
2017 2.139,21 2.134,92 2.131,70 2.129,56<br />
2018 1.816,88 1.813,93 1.811,71 1.810,24<br />
Total 62.093,84 63.127,54 63.902,81 64.419,66<br />
Nota: Cenário 1 = Cui<strong>da</strong><strong>do</strong> Padrão<br />
Cenário 2 = Tratar 50% <strong>da</strong> população Alvo<br />
Cenário 3 = Tratar 80% <strong>da</strong> população Alvo<br />
Cenário 4 = Tratar 100% <strong>da</strong> população Alvo<br />
A tabela 5 demonstra o custo <strong>da</strong> a<strong>do</strong>ção de ca<strong>da</strong> uma <strong>da</strong>s estratégias avalia<strong>da</strong>s para a<br />
população-alvo. Na estimativa apresenta<strong>da</strong>, foi incluí<strong>do</strong> apenas o <strong>tratamento</strong> para <strong>infecção</strong><br />
<strong>pelo</strong> VHC, excluin<strong>do</strong>-se os custos de cui<strong>da</strong><strong>do</strong> relaciona<strong>do</strong>s ao <strong>tratamento</strong> <strong>da</strong> insuficiência<br />
renal crônica ao longo <strong>do</strong> horizonte de tempo defini<strong>do</strong>.