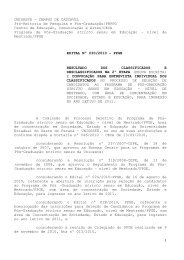
40Tabela 1 – Comparação entre as medidas dos diâmetros dos halos <strong>de</strong> inibição do crescimento microbiano (mm) obtidas pelas metodologias <strong>de</strong> difusão por disco e poçoutilizando extratos aquosos e etanólicos <strong>de</strong> folhas <strong>de</strong> jambolão (Syzygium cumini), jabuticabeira (Myrciaria cauliflora) e goiaberia (Psidium guajava) frente a microorganismospadrãoJambolão Jabuticabeira GoiabeiraAquoso Etanólico Aquoso Etanólico Aquoso EtanólicoD P D P D P D P D P D PMicroorganismos782783784785786Ca0,0± 0,0 a(cv = 0,00%)0,0± 0,0 a(cv = 0,00%)0,0± 0,0 a(cv = 0,00%)0,0± 0,0 a(cv = 0,00%)0,0± 0,0 a(cv = 0,00%)0,0± 0,0 a(cv = 0,00%)0,0± 0,0 a(cv = 0,00%)0,0± 0,0 a(cv = 0,00%)0,0± 0,0 a(cv = 0,00%)0,0± 0,0 a(cv = 0,00%)0,0± 0,0 a(cv = 0,00%)0,0± 0,0 a(cv = 0,00%)Ec9,3± 2,3 a(cv =24,7%)0,0± 0,0 b (cv= 0,00%)9,3± 0,5 a(cv =61,0%)8,3± 4,0 a(cv = 48,4%)0,0± 0,0 a(cv = 11,1%)0,0± 0,0 a(cv = 0,00%)12,0± 1,7 a(cv = 14,4%)13,6± 1,1 a(cv = 8,4%)0,0± 0,0 a(cv = 0,00%)0,0± 0,0 a(cv = 0,00%)9,0± 1,0 b(cv = 11,1%)15,0± 1,0 a(cv = 6,66%)Kp0,0± 0,0 b(cv = 0,00%)9,0± 3,6 a (cv= 40,0%)0,0± 0,0 b(cv = 0,00%)15,6± 1,9 a(cv = 12,0%)0,0± 0,0 a(cv = 0,00%)0,0± 0,0 a(cv = 0,00%)0,0± 0,0 b(cv = 0,00%)19,0± 4,0 a(cv = 21,0%)0,0± 0,0 b(cv = 0,00%)10,0± 3,4 a(cv = 34,6%)0,0± 0,0 b(cv = 0,00%)14± 0,0 a (cv= 0,00%)P a12,3± 2,3 a(cv = 18,7%)10,6± 8,0 a(cv = 75,7%)10,3 ±2,0 b(cv = 20,1%)22,3± 6,0 a(cv = 26,9%)7,6± 1,1 a(cv = 17,3%)10,6± 8,0 a(cv = 75,7%)13,0± 1,7 a(cv = 13,3%)18,6± 6,3 a(cv = 34,0%)0,0± 0,0 b(cv = 0,00%)12,6± 1,1 a(cv = 9,10%)9,6± 1,5 b(cv = 15,8%)16± 1,7 a(cv = 10,8%)ST7,6± 1,5 b(cv = 19,9%)18,6± 1,5 a(cv = 8,1%)8,6± 1,1 b(cv = 13,3%)17,1± 0,7 a(cv = 4,4%)8,6± 0,5 a(cv = 6,66%)18,0± 6,2 a(cv = 34,6%)9,3± 1,1 b(cv = 12,3%)17,6± 3,0 a(cv = 17,2%)7,0± 1,7 b(cv = 24,7%)13,3± 1,5 a(cv = 11,4%)8,3± 0,6 b(cv = 6,9%)16,6± 0,5 a(cv = 3,4%)Sa11,6± 4,9 b(cv = 4,80%)23,2± 2,2 a(cv = 9,60%)15± 2,6 a(cv = 17,6%)18,1± 0,3 a(cv = 1,50%)10,0± 4 b(cv = 40,0%)25± 1,0 a(cv = 4,00%)10,3± 4 b(cv = 43,0%)23,5± 0,5 a(cv = 21,0%)0,0± 0,0 a(cv = 0,00%)0,0± 0,0 a(cv = 0,00%)0,0± 0,0 a(cv = 0,00%)0,0± 0,0 a(cv = 0,00%)Bs0,0± 0,0 a(cv = 0,00%)0,0± 0,0 a(cv = 0,00%)20,0± 3,0 a(cv = 15,0%)13,5± 1,3 b(cv = 2,80%)0,0± 0,0 a(cv = 0,00%)0,0± 0,0 a(cv = 0,00%)11,5± 1,5 a(cv = 13,0%)16,3± 3,0 a(cv = 18,7%)0,0± 0,0 a(cv = 0,00%)0,0± 0,0 a(cv = 0,00%)12,5± 3,5 a(cv = 28,0%)13,6± 0,6 a(cv = 4,2%)D= disco; P= poço; cv = coeficiente <strong>de</strong> variação; Letras distintas na mesma linha indicam diferença significativa entre as metodologias <strong>de</strong> acordo com o teste <strong>de</strong> Tukey (α = 0,05); (0) nãoapresentou inibição; (-) = teste não aplicável; Ca=Candida albicans ATCC 10231, Ec=Escherichia coli ATCC 2592, Kp=Klebsiella pneumoniae ATCC 13883, Pa=Pseudomonas aeruginosaATCC 27853, ST= Salmonella enterica subsp enterica Typhimurium 14028, Sa=Staphylococcus aureus ATCC 25923, Bs=Bacillus subtilis subsp spizizenii CCCD B005.
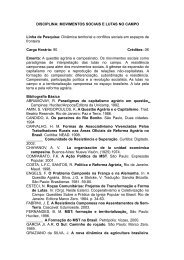
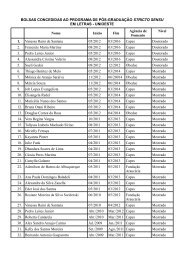
41Tabela 2 – Comparação entre as medidas dos diâmetros dos halos <strong>de</strong> inibição do crescimento microbiano(mm) obtidas pelas metodologias <strong>de</strong> difusão por disco e poço utilizando antimicrobianos comerciais(nistatina, cloranfenicol e gentamicina) frente a micro-organismos padrãoMicro-organismosNistatina Cloranfenicol GentamicinaDisco Poço Disco Poço Disco PoçoCandida albicans ATCC1023141,6± 1,5 a(cv = 3,6%)43,3± 1,0 a(cv = 2,2%)_ _ _ _Escherichia coli ATCC2592__27,0± 2,0 b(cv = 7,4%)51,0± 3,6 a(cv = 7,0%)__Klebsiella pneumoniaeATCC 13883__36,0± 1,0 b(cv = 1,1%)44,0± 1,0 a(cv = 2,2%)__Pseudomonas aeruginosaATCC 27853_ _ _ _36± 4,3 b(cv = 12,1%)45± 0,0 a(cv = 0,00%)Salmonella enterica subspenterica Typhimurium14028__28,3± 3,2 b(cv = 11,3%)40,8± 1,6 a(cv = 3,9%)_Staphylococcus aureusATCC 25923_ _ _ _28,0± 2,6 b(cv = 9,4%)34,3± 0,5 a(cv = 1,17%)Bacillus subtilis subspspizizenii CCCD B005_ _ _ _36,6± 2,0 b(cv = 5,6%)47,6± 2,3 a(cv = 4,8%)787cv = coeficiente <strong>de</strong> variação; Letras distintas na mesma linha indicam diferença significativa entre as metodologias <strong>de</strong>acordo com o teste <strong>de</strong> Tukey (α = 0,05); (0) não apresentou inibição; (-) = teste não aplicável.Tabela 3 - Concentração Inibitória Mínima, Concentração Funcida/Bactericida Mínima (mg/mL - 1 ) dos extratos<strong>de</strong> Myciaria cauliflora, Psidium guajava e Syzygium cumini e antimicrobianos comerciais frente a microorganismospadrãoExtratosCandidaalbicansEscherichiacoliKlebsiellapneumoniaePseudomonasaeruginosaSalmonellaTyphimuriumCIM CFM CIM CBM CIM CBM CIM CBM CIM CBM CIMStaphylococcusaureusBacillussubtilisCBM CIM CBMMyrciariacaulifloraPsidiumguajavaSyzygiumcuminiEtanólico 6,25 ND 0,39 0,39 0,78 3,13 0,39 0,39 0,39 0,78 12,5 ND 6,25 NDAquoso 12,5 ND 3,13 3,13 6,25 25 3,13 3,13 3,13 6,25 25 ND 75 NDEtanólico 12,5 ND 1,56 1,56 1,56 6,25 1,56 1,56 1,56 1,56 12,5 ND 6,25 NDAquoso 12,5 ND 3,13 6,25 25 50 6,25 6,25 6,25 12,5 50 ND 100 NDEtanólico 6,25 ND 0,78 0,78 3,13 6,25 0,7 8 3,13 0,78 6,25 12,5 100 6,25 NDAquoso 6,25 ND 3,13 3,13 3,13 6,25 1,56 1,56 1,56 3,13 25 ND 100 NDCloranfenicol - - 0,04 0,04 0,04 0,04 - - 0,04 0,04 - - - -Gentamicina - - - - - - 0,04 0,09 - - 0,04 0,09 0,04 0,04Nistatina 0,04 0,04 - - - - - - - - - - - -ND= não <strong>de</strong>terminado na faixa <strong>de</strong> concentração testada; (-)= teste não aplicável
- Page 4: FOLHA DE APROVAÇÃOii iv
- Page 7 and 8: SUMÁRIO1. INTRODUÇÃO............
- Page 9 and 10: 11. IntroduçãoDevido à intensiva
- Page 11 and 12: 32. Revisão Bibliográfica2.1. Cad
- Page 13 and 14: 5característica que pode produzir
- Page 15 and 16: 7al., 1997; MOTA et al., 2005). Par
- Page 17 and 18: 9Com esta perspectiva, é fundament
- Page 19 and 20: 11353637383940414243444546474849505
- Page 21 and 22: 13103104105106107108109110111112113
- Page 23 and 24: 15146147148149150151152153154155156
- Page 25 and 26: 17208209210211212213214215216217218
- Page 27 and 28: 19258259260261262263264265266267268
- Page 29 and 30: 21323324325326327328329330331332333
- Page 31 and 32: 23381382383384385386positivas, nega
- Page 33 and 34: 25435436437438439440441442443444445
- Page 35 and 36: 27485Padronização dos inóculos b
- Page 37 and 38: 29535536537538539540541542543544545
- Page 39 and 40: 31585586587588589590591592593594595
- Page 41 and 42: 33635Comparação dos métodos63663
- Page 43 and 44: 35685686687determinação quantitat
- Page 45 and 46: 37730731732733734735736737738739740
- Page 47: 39775776777778779780781SANTURIO, M.
- Page 51 and 52: 31323334353637383940414243444546474
- Page 53 and 54: 88899091929394959697989910010110210
- Page 55 and 56: 15015115215315447Os sorovares testa
- Page 57 and 58: 17317417517617717817918018118218318
- Page 59 and 60: 20420520620720820921021121221321421
- Page 61 and 62: 26426526626726826927027127227327427
- Page 63 and 64: 32232332432532632732832933033133233
- Page 65 and 66: 37837938038138238338438538638738838
- Page 67 and 68: . Acessado em: 22 set.2011.BUTAYE,
- Page 69 and 70: OTHMAN, M.; LOH, H.S.; WIART, C.; K
- Page 71 and 72: ZGODA, J.R.; PORTER, J.R. A Conveni
- Page 73 and 74: Anexo 1 - Normas da Revista Cap. 1R
- Page 75 and 76: esumo em português, palavras-chave
- Page 77 and 78: arquivos@biologico.sp.gov.brAtencio
- Page 79 and 80: Os trabalhos devem ser redigidos em
- Page 81 and 82: sobrenome do autor e ano do documen