- Seite 1 und 2:
S T Statistisches Jahrbuch A TIS T
- Seite 3 und 4:
2 Herausgeber: Thüringer Landesamt
- Seite 5 und 6:
TLS, Statistisches Jahrbuch, Ausgab
- Seite 7 und 8:
TLS, Statistisches Jahrbuch, Ausgab
- Seite 9 und 10:
TLS, Statistisches Jahrbuch, Ausgab
- Seite 11 und 12:
TLS, Statistisches Jahrbuch, Ausgab
- Seite 13 und 14:
TLS, Statistisches Jahrbuch, Ausgab
- Seite 15 und 16:
TLS, Statistisches Jahrbuch, Ausgab
- Seite 17 und 18:
TLS, Statistisches Jahrbuch, Ausgab
- Seite 19 und 20:
9. Verwendung des Bruttoinlandsprod
- Seite 21 und 22:
Quelle Die Angaben beruhen im Allge
- Seite 23 und 24:
TLS, Statistisches Jahrbuch, Ausgab
- Seite 25 und 26: TLS, Statistisches Jahrbuch, Ausgab
- Seite 27 und 28: 51° 50°39' 9°53' Heiligenstadt 1
- Seite 29 und 30: TLS, Statistisches Jahrbuch, Ausgab
- Seite 31 und 32: TLS, Statistisches Jahrbuch, Ausgab
- Seite 33 und 34: Kreisfreie Stadt Landkreis Land TLS
- Seite 35 und 36: TLS, Statistisches Jahrbuch, Ausgab
- Seite 37 und 38: TLS, Statistisches Jahrbuch, Ausgab
- Seite 39 und 40: TLS, Statistisches Jahrbuch, Ausgab
- Seite 41 und 42: TLS, Statistisches Jahrbuch, Ausgab
- Seite 43 und 44: Kreisfreie Stadt Landkreis Land TLS
- Seite 45 und 46: Kreisfreie Stadt Landkreis Land ins
- Seite 47 und 48: TLS, Statistisches Jahrbuch, Ausgab
- Seite 49 und 50: von . . . bis unter . . . Jahren TL
- Seite 51 und 52: Alter von . . . bis unter . . . Jah
- Seite 53 und 54: Alter von . . . bis unter . . . Jah
- Seite 55 und 56: Kreisfreie Stadt Landkreis Land TLS
- Seite 57 und 58: Kreis Gemeinde TLS, Statistisches J
- Seite 59 und 60: Kreis Gemeinde TLS, Statistisches J
- Seite 61 und 62: Kreis Gemeinde TLS, Statistisches J
- Seite 63 und 64: Kreis Gemeinde TLS, Statistisches J
- Seite 65 und 66: Kreis Gemeinde TLS, Statistisches J
- Seite 67 und 68: Kreis Gemeinde TLS, Statistisches J
- Seite 69 und 70: Anzahl der ledigen Kinder Alter des
- Seite 71 und 72: Familie _______ Alter der ledigen K
- Seite 73 und 74: TLS, Statistisches Jahrbuch, Ausgab
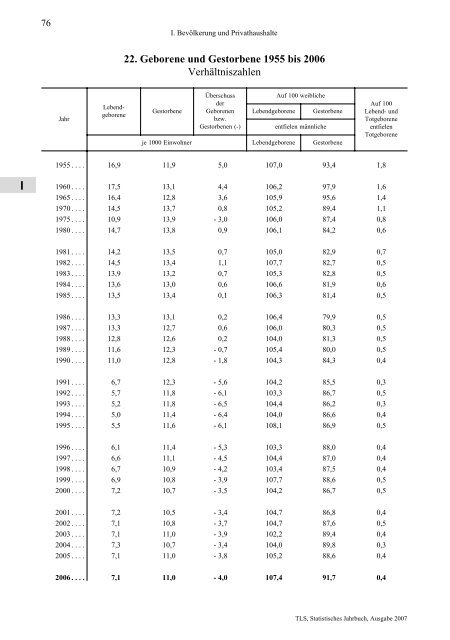
- Seite 75: Jahr Lebendgeborene insgesamt TLS,
- Seite 79 und 80: Jahr TLS, Statistisches Jahrbuch, A
- Seite 81 und 82: Alter von . . . bis unter . . . Jah
- Seite 83 und 84: Jahr Religionszugehörigkeit des Ma
- Seite 85 und 86: Kreisfreie Stadt Landkreis Land TLS
- Seite 87 und 88: A lter der Mutter . . . Jahre 1) TL
- Seite 89 und 90: Jahr Vierteljahr TLS, Statistisches
- Seite 91 und 92: Herkunfts- bzw. Zielland TLS, Stati
- Seite 93 und 94: 2006 nach Kreisen Kreisgrenzen TLS,
- Seite 95 und 96: Herkunfts- bzw. Zielland TLS, Stati
- Seite 97 und 98: TLS, Statistisches Jahrbuch, Ausgab
- Seite 99 und 100: Wahljahr Wahljahr Wahl- berechtigte
- Seite 101 und 102: Wahljahr Wahl- berechtigte _____ Wa
- Seite 103 und 104: Wahljahr TLS, Statistisches Jahrbuc
- Seite 105 und 106: Wahl- kreis- Nr. TLS, Statistisches
- Seite 107 und 108: Wahl- kreis- Nr. Wahlkreis Land TLS
- Seite 109 und 110: Kreisfreie Stadt Landkreis Land Wah
- Seite 111 und 112: TLS, Statistisches Jahrbuch, Ausgab
- Seite 113 und 114: TLS, Statistisches Jahrbuch, Ausgab
- Seite 115 und 116: TLS, Statistisches Jahrbuch, Ausgab
- Seite 117 und 118: TLS, Statistisches Jahrbuch, Ausgab
- Seite 119 und 120: 29,7% 13,2% 250 Tausend 200 150 100
- Seite 121 und 122: Kreisfreie Stadt Landkreis Land TLS
- Seite 123 und 124: Kreisfreie Stadt Landkreis Land TLS
- Seite 125 und 126: Kreisfreie Stadt Landkreis Land I n
- Seite 127 und 128:
Alter von . . . bis unter . . . Jah
- Seite 129 und 130:
Wirtschaftsbereich TLS, Statistisch
- Seite 131 und 132:
Beteiligung am Erwerbsleben TLS, St
- Seite 133 und 134:
Kreisfreie Stadt Landkreis Land TLS
- Seite 135 und 136:
TLS, Statistisches Jahrbuch, Ausgab
- Seite 137 und 138:
TLS, Statistisches Jahrbuch, Ausgab
- Seite 139 und 140:
Unternehmen *) und ihre sv-pflichti
- Seite 141 und 142:
WZ 2003 Wirtschaftsabschnitt TLS, S
- Seite 143 und 144:
Kreisfreie Stadt Landkreis Land TLS
- Seite 145 und 146:
Land- und Forstwirtschaft; Fischere
- Seite 147 und 148:
dem Grund der Meldung und Kreisen *
- Seite 149 und 150:
Land- und Forstwirtschaft; Fischere
- Seite 151 und 152:
Merkmal TLS, Statistisches Jahrbuch
- Seite 153 und 154:
A Jahr _____ Rechtsform lter der __
- Seite 155 und 156:
Kreisfreie Stadt Landkreis Land TLS
- Seite 157 und 158:
TLS, Statistisches Jahrbuch, Ausgab
- Seite 159 und 160:
TLS, Statistisches Jahrbuch, Ausgab
- Seite 161 und 162:
1400 Tausend 1200 1000 800 600 400
- Seite 163 und 164:
Verkehrs- fläche TLS, Statistische
- Seite 165 und 166:
Jahr _____ Kreisfreie Stadt Landkre
- Seite 167 und 168:
TLS, Statistisches Jahrbuch, Ausgab
- Seite 169 und 170:
Hafer Triticale TLS, Statistisches
- Seite 171 und 172:
TLS, Statistisches Jahrbuch, Ausgab
- Seite 173 und 174:
TLS, Statistisches Jahrbuch, Ausgab
- Seite 175 und 176:
Tierart TLS, Statistisches Jahrbuch
- Seite 177 und 178:
Davon TLS, Statistisches Jahrbuch,
- Seite 179 und 180:
is unter . . . kg Lebendgewicht Zuc
- Seite 181 und 182:
Jahr Hennenhaltungs- 1) p lätze im
- Seite 183 und 184:
TLS, Statistisches Jahrbuch, Ausgab
- Seite 185 und 186:
TLS, Statistisches Jahrbuch, Ausgab
- Seite 187 und 188:
TLS, Statistisches Jahrbuch, Ausgab
- Seite 189 und 190:
TLS, Statistisches Jahrbuch, Ausgab
- Seite 191 und 192:
TLS, Statistisches Jahrbuch, Ausgab
- Seite 193 und 194:
Geleistete Arbeits- stunden Bruttol
- Seite 195 und 196:
Bruttolohn- und Bruttogehalt- summe
- Seite 197 und 198:
Umsatz TLS, Statistisches Jahrbuch,
- Seite 199 und 200:
TLS, Statistisches Jahrbuch, Ausgab
- Seite 201 und 202:
Güterabteilung Gütergruppe bzw. -
- Seite 203 und 204:
WZ 2003 TLS, Statistisches Jahrbuch
- Seite 205 und 206:
Maschinen, maschinelle Anlagen, Bet
- Seite 207 und 208:
anlageinvestitionen Maschinen, masc
- Seite 209 und 210:
TLS, Statistisches Jahrbuch, Ausgab
- Seite 211 und 212:
Jahr _______ Kreisfreie Stadt Landk
- Seite 213 und 214:
Jahr _______ Kreisfreie Stadt Landk
- Seite 215 und 216:
TLS, Statistisches Jahrbuch, Ausgab
- Seite 217 und 218:
mit . . . bis . . . Beschäftigten
- Seite 219 und 220:
WZ 2003 TLS, Statistisches Jahrbuch
- Seite 221 und 222:
Jahr _______ Kreisfreie Stadt Landk
- Seite 223 und 224:
Jahr Insgesamt TLS, Statistisches J
- Seite 225 und 226:
1) Einfuhrüberschuss Jahr Merkmal
- Seite 227 und 228:
TLS, Statistisches Jahrbuch, Ausgab
- Seite 229 und 230:
TLS, Statistisches Jahrbuch, Ausgab
- Seite 231 und 232:
TLS, Statistisches Jahrbuch, Ausgab
- Seite 233 und 234:
6000 5000 4000 3000 2000 1000 0 Gem
- Seite 235 und 236:
TLS, Statistisches Jahrbuch, Ausgab
- Seite 237 und 238:
TLS, Statistisches Jahrbuch, Ausgab
- Seite 239 und 240:
Stichtag ( 31. 12. ) _______ Gebäu
- Seite 241 und 242:
fläche am 31.12.2006 nach Kreisen
- Seite 243 und 244:
TLS, Statistisches Jahrbuch, Ausgab
- Seite 245 und 246:
Jahr ______ Kreisfreie Stadt Landkr
- Seite 247 und 248:
VIII. Handel, Gastgewerbe, Dienstle
- Seite 249 und 250:
Betriebliche Steuern und sonstige
- Seite 251 und 252:
Jahresdurchschnitt Monat TLS, Stati
- Seite 253 und 254:
Jahres- durchschnitt Monat TLS, Sta
- Seite 255 und 256:
Jahresdurchschnitt Monat TLS, Stati
- Seite 257 und 258:
Jahresdurchschnitt Monat TLS, Stati
- Seite 259 und 260:
WZ2003 Wirtschaftsbereich TLS, Stat
- Seite 261 und 262:
TLS, Statistisches Jahrbuch, Ausgab
- Seite 263 und 264:
Jahr _____ Kreisfreie Stadt Landkre
- Seite 265 und 266:
Reisegebiet _____ Betriebsart TLS,
- Seite 267 und 268:
Betriebsart _____ Ständiger Wohnsi
- Seite 269 und 270:
Jahr _____ Kreisfreie Stadt Landkre
- Seite 271 und 272:
Reisegebiet _____ Betriebsart TLS,
- Seite 273 und 274:
TLS, Statistisches Jahrbuch, Ausgab
- Seite 275 und 276:
Vereinigtes Königreich Tschechisch
- Seite 277 und 278:
Jahr _____ Erdteil Verbrauchsland T
- Seite 279 und 280:
Jahr _____ Erdteil Herstellungsland
- Seite 281 und 282:
TLS, Statistisches Jahrbuch, Ausgab
- Seite 283 und 284:
TLS, Statistisches Jahrbuch, Ausgab
- Seite 285 und 286:
TLS, Statistisches Jahrbuch, Ausgab
- Seite 287 und 288:
Verkehrsart TLS, Statistisches Jahr
- Seite 289 und 290:
Jahr Quelle: Kraftfahrt-Bundesamt u
- Seite 291 und 292:
sowie Verunglückte 2006 nach Kreis
- Seite 293 und 294:
TLS, Statistisches Jahrbuch, Ausgab
- Seite 295 und 296:
Unfallart _______ Ortslage TLS, Sta
- Seite 297 und 298:
Ursache TLS, Statistisches Jahrbuch
- Seite 299 und 300:
TLS, Statistisches Jahrbuch, Ausgab
- Seite 301 und 302:
Merkmal TLS, Statistisches Jahrbuch
- Seite 303 und 304:
Merkmal Vierteljahr TLS, Statistisc
- Seite 305 und 306:
TLS, Statistisches Jahrbuch, Ausgab
- Seite 307 und 308:
TLS, Statistisches Jahrbuch, Ausgab
- Seite 309 und 310:
Gefangene in den Justizvollzugsanst
- Seite 311 und 312:
Hauptdeliktgruppe Straftat TLS, Sta
- Seite 313 und 314:
Art der Strafe TLS, Statistisches J
- Seite 315 und 316:
ins- g esamt 2) TLS, Statistisches
- Seite 317 und 318:
arten und Hauptdeliktgruppen *) 31.
- Seite 319 und 320:
TLS, Statistisches Jahrbuch, Ausgab
- Seite 321 und 322:
TLS, Statistisches Jahrbuch, Ausgab
- Seite 323 und 324:
TLS, Statistisches Jahrbuch, Ausgab
- Seite 325 und 326:
TLS, Statistisches Jahrbuch, Ausgab
- Seite 327 und 328:
TLS, Statistisches Jahrbuch, Ausgab
- Seite 329 und 330:
TLS, Statistisches Jahrbuch, Ausgab
- Seite 331 und 332:
TLS, Statistisches Jahrbuch, Ausgab
- Seite 333 und 334:
Berufliches Gymnasium Das beruflich
- Seite 335 und 336:
Auszubildende, neu abgeschlossene u
- Seite 337 und 338:
2006/07 nach Schularten und Kreisen
- Seite 339 und 340:
2006/07 nach Schulformen und Kreise
- Seite 341 und 342:
Schuljahr — — - Kreisfreie Stad
- Seite 343 und 344:
TLS, Statistisches Jahrbuch, Ausgab
- Seite 345 und 346:
TLS, Statistisches Jahrbuch, Ausgab
- Seite 347 und 348:
TLS, Statistisches Jahrbuch, Ausgab
- Seite 349 und 350:
Fächergruppe — — - a insgesamt
- Seite 351 und 352:
Fächergruppe — — - a insgesamt
- Seite 353 und 354:
Spielzeit — — - Theaterunterneh
- Seite 355 und 356:
TLS, Statistisches Jahrbuch, Ausgab
- Seite 357 und 358:
Museumsart - - - Trägerschaft TLS,
- Seite 359 und 360:
Jahr Ortsfeste Leinwände TLS, Stat
- Seite 361 und 362:
Stichtag ( 1. 1. ) _____ Kreisfreie
- Seite 363 und 364:
Die Krankenhausstatistik wird als j
- Seite 365 und 366:
1600 1400 1200 1000 800 600 400 200
- Seite 367 und 368:
TLS, Statistisches Jahrbuch, Ausgab
- Seite 369 und 370:
Entlassungen aus der vollstationär
- Seite 371 und 372:
Stichtag — — - Gebiets-/ Schwer
- Seite 373 und 374:
Stichtag — — - Personalgruppe B
- Seite 375 und 376:
TLS, Statistisches Jahrbuch, Ausgab
- Seite 377 und 378:
Stichtag _______ Personalgruppe Ber
- Seite 379 und 380:
Jahresdurchschnitt — — - Kreisf
- Seite 381 und 382:
TLS, Statistisches Jahrbuch, Ausgab
- Seite 383 und 384:
TLS, Statistisches Jahrbuch, Ausgab
- Seite 385 und 386:
insgesamt TLS, Statistisches Jahrbu
- Seite 387 und 388:
Geschlecht und Todesursachen TLS, S
- Seite 389 und 390:
Geschlecht und Todesursachen TLS, S
- Seite 391 und 392:
im Alter von . . . bis unter . . .
- Seite 393 und 394:
Stichtag _____ Fachgebiet TLS, Stat
- Seite 395 und 396:
TLS, Statistisches Jahrbuch, Ausgab
- Seite 397 und 398:
wird Mietern und Eigentümern als M
- Seite 399 und 400:
Kindertagespflege Sie bezeichnet di
- Seite 401 und 402:
Stichtag _____ Kreisfreie Stadt Lan
- Seite 403 und 404:
Stichtag _____ Kreisfreie Stadt Lan
- Seite 405 und 406:
TLS, Statistisches Jahrbuch, Ausgab
- Seite 407 und 408:
Stichtag _____ Kreisfreie Stadt Lan
- Seite 409 und 410:
Stichtag - - - - - Kreisfreie Stadt
- Seite 411 und 412:
TLS, Statistisches Jahrbuch, Ausgab
- Seite 413 und 414:
zwar unter . . . Jahren TLS, Statis
- Seite 415 und 416:
Art der usgaben bzw. TLS, Statistis
- Seite 417 und 418:
TLS, Statistisches Jahrbuch, Ausgab
- Seite 419 und 420:
TLS, Statistisches Jahrbuch, Ausgab
- Seite 421 und 422:
Stichtag _____ Bezugsperson _____ F
- Seite 423 und 424:
TLS, Statistisches Jahrbuch, Ausgab
- Seite 425 und 426:
TLS, Statistisches Jahrbuch, Ausgab
- Seite 427 und 428:
Kreisfreie Stadt Landkreis Land TLS
- Seite 429 und 430:
TLS, Statistisches Jahrbuch, Ausgab
- Seite 431 und 432:
Personal im öffentlichen Dienst Zu
- Seite 433 und 434:
14,6% TLS, Statistisches Jahrbuch,
- Seite 435 und 436:
is 2006 nach Ausgabearten TLS, Stat
- Seite 437 und 438:
is 2006 nach Einnahmearten TLS, Sta
- Seite 439 und 440:
Aufgabenbereichen und Ausgabearten
- Seite 441 und 442:
Aufgabenbereichen und Ausgabearten
- Seite 443 und 444:
TLS, Statistisches Jahrbuch, Ausgab
- Seite 445 und 446:
Aufgabenbereichen und Einnahmearten
- Seite 447 und 448:
TLS, Statistisches Jahrbuch, Ausgab
- Seite 449 und 450:
TLS, Statistisches Jahrbuch, Ausgab
- Seite 451 und 452:
Gl. - Nr. Aufgabenbereich TLS, Stat
- Seite 453 und 454:
2) z usammen TLS, Statistisches Jah
- Seite 455 und 456:
darunter Schlüssel- zuweisungen TL
- Seite 457 und 458:
Ausgabeart 1) ohne haushaltstechnis
- Seite 459 und 460:
Einnahmeart TLS, Statistisches Jahr
- Seite 461 und 462:
2) z usammen TLS, Statistisches Jah
- Seite 463 und 464:
darunter Schlüssel- zuweisungen TL
- Seite 465 und 466:
steuern H ebesatz 1) Realsteueraufb
- Seite 467 und 468:
steuern H ebesatz 2) Realsteueraufb
- Seite 469 und 470:
1999 2000 2001 2 002 TLS, Statistis
- Seite 471 und 472:
Stichtag ( 31. 12. ) _______ Schuld
- Seite 473 und 474:
Schuldenstand am 31. 12. 2006 TLS,
- Seite 475 und 476:
Schuldenstand am 31. 12. 2006 TLS,
- Seite 477 und 478:
Jahr _____ Hochschulart _____ Fäch
- Seite 479 und 480:
nach Dienstverhältnis Beamte und R
- Seite 481 und 482:
am 30.6.2006 nach Kreisen nach D Be
- Seite 483 und 484:
nach Dienstverhältnis Beamte A rbe
- Seite 485 und 486:
TLS, Statistisches Jahrbuch, Ausgab
- Seite 487 und 488:
Jahr _______ Wirtschaftszweig TLS,
- Seite 489 und 490:
Lieferungen und Leistungen von . .
- Seite 491 und 492:
TLS, Statistisches Jahrbuch, Ausgab
- Seite 493 und 494:
TLS, Statistisches Jahrbuch, Ausgab
- Seite 495 und 496:
Bruttomonatsgehälter der kaufmänn
- Seite 497 und 498:
Bruttostundenlöhne der Arbeiter TL
- Seite 499 und 500:
TLS, Statistisches Jahrbuch, Ausgab
- Seite 501 und 502:
TLS, Statistisches Jahrbuch, Ausgab
- Seite 503 und 504:
TLS, Statistisches Jahrbuch, Ausgab
- Seite 505 und 506:
Jahresdurchschnitt Monat TLS, Stati
- Seite 507 und 508:
gruppe Gesundheits- pflege Verkehr
- Seite 509 und 510:
gruppe Gesundheits- pflege Verkehr
- Seite 511 und 512:
TLS, Statistisches Jahrbuch, Ausgab
- Seite 513 und 514:
Jahr TLS, Statistisches Jahrbuch, A
- Seite 515 und 516:
Jahr TLS, Statistisches Jahrbuch, A
- Seite 517 und 518:
FdlN von . . . bis unter . . . ha J
- Seite 519 und 520:
TLS, Statistisches Jahrbuch, Ausgab
- Seite 521 und 522:
TLS, Statistisches Jahrbuch, Ausgab
- Seite 523 und 524:
Transferleistungen Zu den (von priv
- Seite 525 und 526:
Jahr TLS, Statistisches Jahrbuch, A
- Seite 527 und 528:
TLS, Statistisches Jahrbuch, Ausgab
- Seite 529 und 530:
TLS, Statistisches Jahrbuch, Ausgab
- Seite 531 und 532:
Land- und Forst- wirtschaft; Fische
- Seite 533 und 534:
Jahr TLS, Statistisches Jahrbuch, A
- Seite 535 und 536:
Jahr TLS, Statistisches Jahrbuch, A
- Seite 537 und 538:
TLS, Statistisches Jahrbuch, Ausgab
- Seite 539 und 540:
inlandsprodukts 1995 bis 2005 *) TL
- Seite 541 und 542:
TLS, Statistisches Jahrbuch, Ausgab
- Seite 543 und 544:
Unfälle mit wassergefährdenden St
- Seite 545 und 546:
treiben. Weiterhin werden Betriebe
- Seite 547 und 548:
TLS, Statistisches Jahrbuch, Ausgab
- Seite 549 und 550:
Jahr Jahr Jahr TLS, Statistisches J
- Seite 551 und 552:
Jahr TLS, Statistisches Jahrbuch, A
- Seite 553 und 554:
Jahr _______ Wirtschaftszweig TLS,
- Seite 555 und 556:
Jahr _____ a insgesamt b darunter g
- Seite 557 und 558:
Verpackungsart TLS, Statistisches J
- Seite 559 und 560:
Jahr _____ Kreisfreie Stadt Landkre
- Seite 561 und 562:
Jahr _____ Kreisfreie Stadt Landkre
- Seite 563 und 564:
Wirtschaftszweig ( WZ 2003) TLS, St
- Seite 565 und 566:
Territoriale Gliederungen Eichsfeld
- Seite 567 und 568:
Eichsfeld / Harzvorland Südwestth
- Seite 569 und 570:
Eichsfeld Eisenach Wartburgkreis Ei
- Seite 571 und 572:
der Bundesländer *) Hamburg Hessen
- Seite 573 und 574:
der Bundesländer *) Hamburg Hessen
- Seite 575 und 576:
der Bundesländer *) Hamburg Hessen
- Seite 577 und 578:
der Bundesländer *) Hamburg Hessen
- Seite 579 und 580:
der Bundesländer *) Hamburg Hessen
- Seite 581 und 582:
der Bundesländer *) Hamburg Hessen
- Seite 583 und 584:
der Bundesländer *) Hamburg Hessen
- Seite 585 und 586:
der Bundesländer *) Hamburg Hessen
- Seite 587 und 588:
Abschnitt Unter- abschnitt TLS, Sta
- Seite 589 und 590:
A Abfall 543, 544, 546, 555-562 Abg
- Seite 591 und 592:
E Ehedauer 84 Ehelösungen, -scheid
- Seite 593 und 594:
Hochbau 183, 188, 189, 191, 208-210
- Seite 595 und 596:
Personal (siehe Beschäftigte) Pers
- Seite 597:
V veranschlagte Kosten der Bauwerke