Wasser im Gartenbau : Tagungsband zum Statusseminar am 9 ... - vTI
Wasser im Gartenbau : Tagungsband zum Statusseminar am 9 ... - vTI
Wasser im Gartenbau : Tagungsband zum Statusseminar am 9 ... - vTI

Sie wollen auch ein ePaper? Erhöhen Sie die Reichweite Ihrer Titel.
YUMPU macht aus Druck-PDFs automatisch weboptimierte ePaper, die Google liebt.
Landbauforschung – Sonderheft 328 (2009) 15<br />
Chen, 2005; Matulla et al., 2002) is the most recommended<br />
way to do this. However, due to the<br />
complexity of this task and the l<strong>im</strong>ited t<strong>im</strong>e fr<strong>am</strong>e<br />
of this study this has not been carried out here.<br />
Instead, to over come the systematic difference<br />
between the DWD and MM5 data sets two<br />
pragmatic steps were undertaken. In a first step<br />
the differences between the MM5 periods 1961–<br />
1989 and 2071–2099 have been determined, assuming<br />
that these differences reflect the cl<strong>im</strong>ate<br />
change. In a second step, the net difference between<br />
the MM5 data sets has been added up to<br />
the values given by the DWD data set 1961–<br />
1989. In this way the probable <strong>im</strong>pact of cl<strong>im</strong>ate<br />
change, expressed by the difference in the precipitation<br />
values of the MM5 periods, on groundwater<br />
recharge is related to groundwater recharge<br />
levels, which have been assed using observed<br />
precipitation values given by the DWD<br />
data set as input:<br />
�PMM � 5 �<br />
PCC � PDWD 1961�1989<br />
� 52071� 2099 PMM 1961�1989<br />
Equation 4<br />
Leaving all other model input par<strong>am</strong>eters (table 1)<br />
unchanged, the net difference within the data<br />
sets from the MM5 is used to predict the <strong>im</strong>pacts<br />
of cl<strong>im</strong>ate change scenarios on groundwater resources<br />
in north-western Germany.<br />
6 Results<br />
6.1 Groundwater recharge rates for the hydrologic<br />
reference period 1961–1990<br />
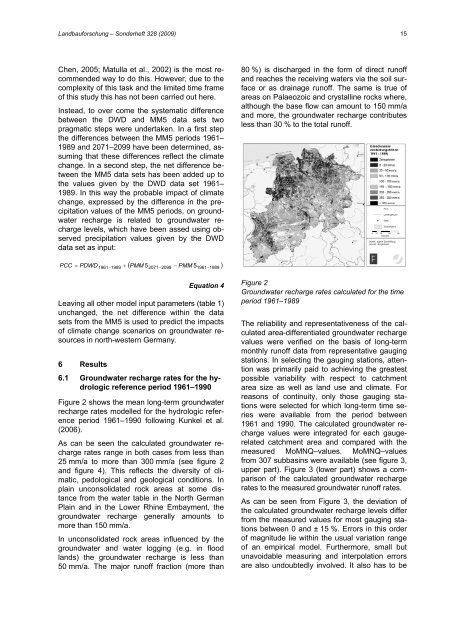
Figure 2 shows the mean long-term groundwater<br />
recharge rates modelled for the hydrologic reference<br />
period 1961–1990 following Kunkel et al.<br />
(2006).<br />
As can be seen the calculated groundwater recharge<br />
rates range in both cases from less than<br />
25 mm/a to more than 300 mm/a (see figure 2<br />
and figure 4). This reflects the diversity of cl<strong>im</strong>atic,<br />
pedological and geological conditions. In<br />
plain unconsolidated rock areas at some distance<br />
from the water table in the North German<br />
Plain and in the Lower Rhine Embayment, the<br />
groundwater recharge generally <strong>am</strong>ounts to<br />
more than 150 mm/a.<br />
In unconsolidated rock areas influenced by the<br />
groundwater and water logging (e.g. in flood<br />
lands) the groundwater recharge is less than<br />
50 mm/a. The major runoff fraction (more than<br />
80 %) is discharged in the form of direct runoff<br />
and reaches the receiving waters via the soil surface<br />
or as drainage runoff. The s<strong>am</strong>e is true of<br />
areas on Palaeozoic and crystalline rocks where,<br />
although the base flow can <strong>am</strong>ount to 150 mm/a<br />
and more, the groundwater recharge contributes<br />
less than 30 % to the total runoff.<br />
Figure 2<br />
Groundwater recharge rates calculated for the t<strong>im</strong>e<br />
period 1961–1989<br />
The reliability and representativeness of the calculated<br />
area-differentiated groundwater recharge<br />
values were verified on the basis of long-term<br />
monthly runoff data from representative gauging<br />
stations. In selecting the gauging stations, attention<br />
was pr<strong>im</strong>arily paid to achieving the greatest<br />
possible variability with respect to catchment<br />
area size as well as land use and cl<strong>im</strong>ate. For<br />
reasons of continuity, only those gauging stations<br />
were selected for which long-term t<strong>im</strong>e series<br />
were available from the period between<br />
1961 and 1990. The calculated groundwater recharge<br />
values were integrated for each gaugerelated<br />
catchment area and compared with the<br />
measured MoMNQ–values. MoMNQ–values<br />
from 307 subbasins were available (see figure 3,<br />
upper part). Figure 3 (lower part) shows a comparison<br />
of the calculated groundwater recharge<br />
rates to the measured groundwater runoff rates.<br />
As can be seen from Figure 3, the deviation of<br />
the calculated groundwater recharge levels differ<br />
from the measured values for most gauging stations<br />
between 0 and ± 15 %. Errors in this order<br />
of magnitude lie within the usual variation range<br />
of an empirical model. Furthermore, small but<br />
unavoidable measuring and interpolation errors<br />
are also undoubtedly involved. It also has to be