ANNUAL REPORT 2008/09 - Sonova
ANNUAL REPORT 2008/09 - Sonova
ANNUAL REPORT 2008/09 - Sonova

You also want an ePaper? Increase the reach of your titles
YUMPU automatically turns print PDFs into web optimized ePapers that Google loves.
Innovation was and remains the most important growth<br />
driver. Thanks to innovative product solutions, the company<br />
was able to grow in the last fi nancial year even during<br />
those months which were characterized by downward<br />
trends in the hearing instruments industry. The fi rst three<br />
quarters of the reporting period were weaker due to<br />
general economic factors. The stronger growth in the last<br />
quarter was driven by the launch of new products and<br />
helped also by the stabilization of the market. Further<br />
growth was achieved through entry into new markets such<br />
as Singapore and Turkey and the continuous expansion<br />
of our sales and distribution activities.<br />
All acquisitions undertaken in the fi nancial year under<br />
review were in the fi eld of hearing system sales and distribution.<br />
This also included the acquisition of retail companies<br />
in selected countries. Part of <strong>Sonova</strong>’s strategy is<br />
to secure and expand its distribution channels through<br />
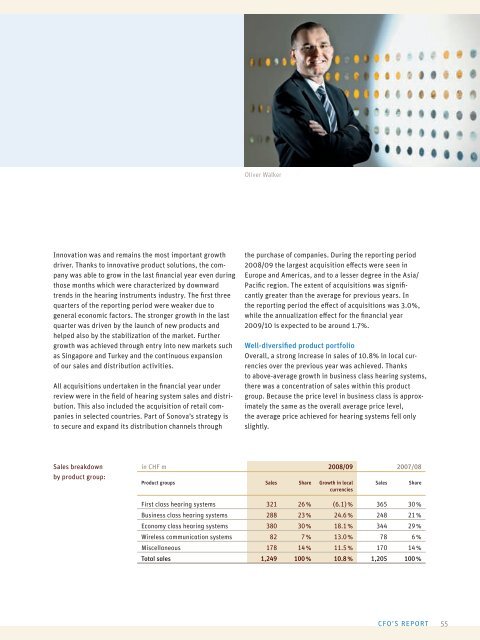
Sales breakdown<br />
by product group:<br />
Oliver Walker<br />
the purchase of companies. During the reporting period<br />
<strong>2008</strong>/<strong>09</strong> the largest acquisition eff ects were seen in<br />
Europe and Americas, and to a lesser degree in the Asia/<br />
Pacifi c region. The extent of acquisitions was signifi -<br />
cantly greater than the average for previous years. In<br />
the reporting period the eff ect of acquisitions was 3.0%,<br />
while the annualization eff ect for the fi nancial year<br />
20<strong>09</strong>/10 is expected to be around 1.7%.<br />
Well-diversifi ed product portfolio<br />
Overall, a strong increase in sales of 10.8% in local currencies<br />
over the previous year was achieved. Thanks<br />
to above-average growth in business class hearing systems,<br />
there was a concentration of sales within this product<br />
group. Because the price level in business class is approximately<br />
the same as the overall average price level,<br />
the average price achieved for hearing systems fell only<br />
slightly.<br />
in CHF m <strong>2008</strong>/<strong>09</strong> 2007/08<br />
Product groups Sales Share Growth in local<br />
currencies<br />
Sales Share<br />
First class hearing systems 321 26 % (6.1) % 365 30 %<br />
Business class hearing systems 288 23 % 24.6 % 248 21 %<br />
Economy class hearing systems 380 30 % 18.1 % 344 29 %<br />
Wireless communication systems 82 7 % 13.0 % 78 6 %<br />
Miscellaneous 178 14 % 11.5 % 170 14 %<br />
Total sales 1,249 100 % 10.8 % 1,205 100 %<br />
CFO’S <strong>REPORT</strong><br />
55