ANNUAL REPORT 2008/09 - Sonova
ANNUAL REPORT 2008/09 - Sonova
ANNUAL REPORT 2008/09 - Sonova

You also want an ePaper? Increase the reach of your titles
YUMPU automatically turns print PDFs into web optimized ePapers that Google loves.
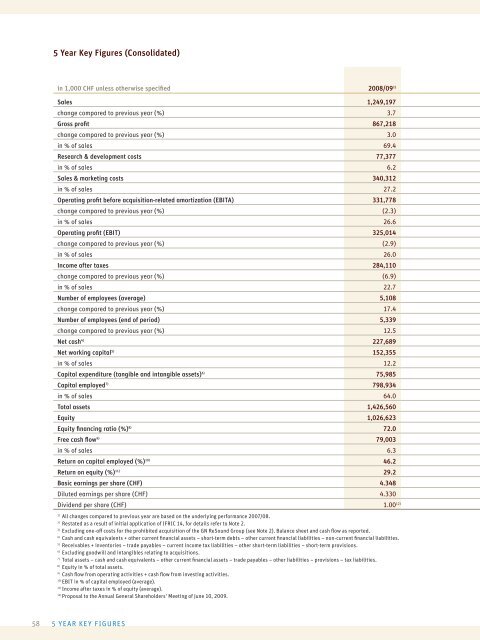
5 Year Key Figures (Consolidated)<br />
in 1,000 CHF unless otherwise specifi ed <strong>2008</strong>/<strong>09</strong> 1)<br />
Sales 1,249,197<br />
change compared to previous year (%) 3.7<br />
Gross profi t 867,218<br />
change compared to previous year (%) 3.0<br />
in % of sales 69.4<br />
Research & development costs 77,377<br />
in % of sales 6.2<br />
Sales & marketing costs 340,312<br />
in % of sales 27.2<br />
Operating profi t before acquisition-related amortization (EBITA) 331,778<br />
change compared to previous year (%) (2.3)<br />
in % of sales 26.6<br />
Operating profi t (EBIT) 325,014<br />
change compared to previous year (%) (2.9)<br />
in % of sales 26.0<br />
Income after taxes 284,110<br />
change compared to previous year (%) (6.9)<br />
in % of sales 22.7<br />
Number of employees (average) 5,108<br />
change compared to previous year (%) 17.4<br />
Number of employees (end of period) 5,339<br />
change compared to previous year (%) 12.5<br />
Net cash 4) 227,689<br />
Net working capital 5) 152,355<br />
in % of sales 12.2<br />
Capital expenditure (tangible and intangible assets) 6) 75,985<br />
Capital employed 7) 798,934<br />
in % of sales 64.0<br />
Total assets 1,426,560<br />
Equity 1,026,623<br />
Equity fi nancing ratio (%) 8) 72.0<br />
Free cash fl ow 9) 79,003<br />
in % of sales 6.3<br />
Return on capital employed (%) 10) 46.2<br />
Return on equity (%) 11) 29.2<br />
Basic earnings per share (CHF) 4.348<br />
Diluted earnings per share (CHF) 4.330<br />
Dividend per share (CHF) 1.00 12)<br />
1) All changes compared to previous year are based on the underlying performance 2007/08.<br />
2) Restated as a result of initial application of IFRIC 14, for details refer to Note 2.<br />
3) Excluding one-off costs for the prohibited acquisition of the GN ReSound Group (see Note 2). Balance sheet and cash fl ow as reported.<br />
4) Cash and cash equivalents + other current fi nancial assets – short-term debts – other current fi nancial liabilities – non-current fi nancial liabilities.<br />
5) Receivables + inventories – trade payables – current income tax liabilities – other short-term liabilities – short-term provisions.<br />
6) Excluding goodwill and intangibles relating to acquisitions.<br />
7) Total assets – cash and cash equivalents – other current fi nancial assets – trade payables – other liabilities – provisions – tax liabilities.<br />
8) Equity in % of total assets.<br />
9) Cash fl ow from operating activities + cash fl ow from investing activities.<br />
10) EBIT in % of capital employed (average).<br />
11) Income after taxes in % of equity (average).<br />
12) Proposal to the Annual General Shareholders’ Meeting of June 10, 20<strong>09</strong>.<br />
58 5 YEAR KEY FIGURES