ANNUAL REPORT 2008/09 - Sonova
ANNUAL REPORT 2008/09 - Sonova
ANNUAL REPORT 2008/09 - Sonova

Create successful ePaper yourself
Turn your PDF publications into a flip-book with our unique Google optimized e-Paper software.
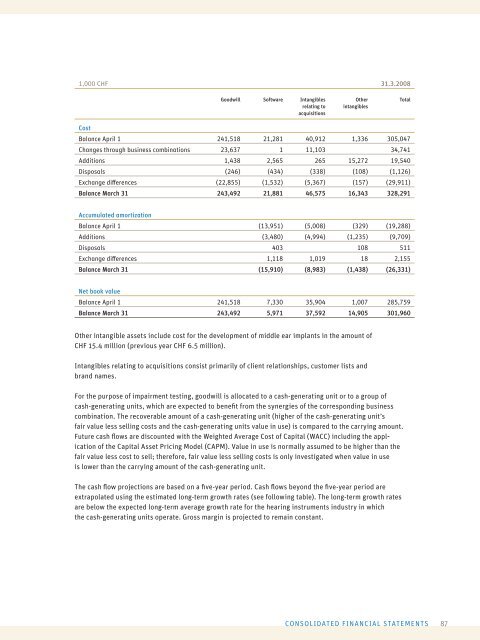
1,000 CHF 31.3.<strong>2008</strong><br />
Cost<br />
Goodwill Software Intangibles<br />
relating to<br />
acquisitions<br />
Other<br />
intangibles<br />
Balance April 1 241,518 21,281 40,912 1,336 305,047<br />
Changes through business combinations 23,637 1 11,103 34,741<br />
Additions 1,438 2,565 265 15,272 19,540<br />
Disposals (246) (434) (338) (108) (1,126)<br />
Exchange diff erences (22,855) (1,532) (5,367) (157) (29,911)<br />
Balance March 31 243,492 21,881 46,575 16,343 328,291<br />
Accumulated amortization<br />
Balance April 1 (13,951) (5,008) (329) (19,288)<br />
Additions (3,480) (4,994) (1,235) (9,7<strong>09</strong>)<br />
Disposals 403 108 511<br />
Exchange diff erences 1,118 1,019 18 2,155<br />
Balance March 31 (15,910) (8,983) (1,438) (26,331)<br />
Net book value<br />
Balance April 1 241,518 7,330 35,904 1,007 285,759<br />
Balance March 31 243,492 5,971 37,592 14,905 301,960<br />
Other intangible assets include cost for the development of middle ear implants in the amount of<br />
CHF 15.4 million (previous year CHF 6.5 million).<br />
Intangibles relating to acquisitions consist primarily of client relationships, customer lists and<br />
brand names.<br />
For the purpose of impairment testing, goodwill is allocated to a cash-generating unit or to a group of<br />
cash-generating units, which are expected to benefi t from the synergies of the corresponding business<br />
combination. The recoverable amount of a cash-generating unit (higher of the cash-generating unit’s<br />
fair value less selling costs and the cash- generating units value in use) is compared to the carrying amount.<br />
Future cash fl ows are discounted with the Weighted Average Cost of Capital (WACC) including the application<br />
of the Capital Asset Pricing Model (CAPM). Value in use is normally assumed to be higher than the<br />
fair value less cost to sell; therefore, fair value less selling costs is only investigated when value in use<br />
is lower than the carrying amount of the cash-generating unit.<br />
The cash fl ow projections are based on a fi ve-year period. Cash fl ows beyond the fi ve-year period are<br />
extrapolated using the estimated long-term growth rates (see following table). The long-term growth rates<br />
are below the expected long-term average growth rate for the hearing instruments industry in which<br />
the cash-gen erating units operate. Gross margin is projected to remain constant.<br />
Total<br />
CONSOLIDATED FINANCIAL STATEMENTS<br />
87