ANNUAL REPORT 2008/09 - Sonova
ANNUAL REPORT 2008/09 - Sonova
ANNUAL REPORT 2008/09 - Sonova

You also want an ePaper? Increase the reach of your titles
YUMPU automatically turns print PDFs into web optimized ePapers that Google loves.
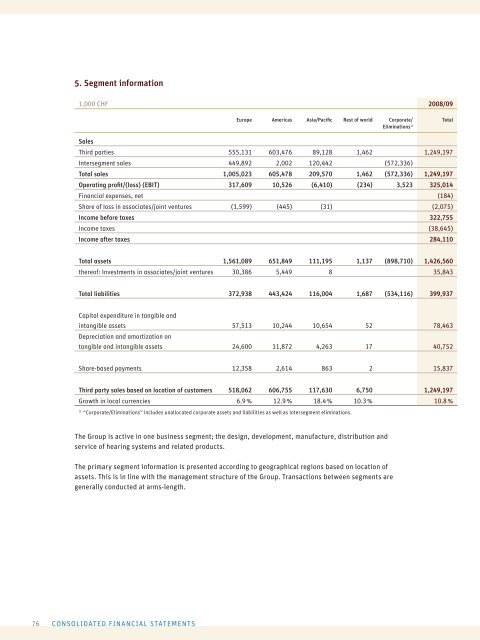
5. Segment information<br />
1,000 CHF <strong>2008</strong>/<strong>09</strong><br />
Sales<br />
76 CONSOLIDATED FINANCIAL STATEMENTS<br />
Europe Americas Asia/Pacifi c Rest of world Corporate/<br />
Eliminations 1)<br />
Third parties 555,131 603,476 89,128 1,462 1,249,197<br />
Intersegment sales 449,892 2,002 120,442 (572,336)<br />
Total sales 1,005,023 605,478 2<strong>09</strong>,570 1,462 (572,336) 1,249,197<br />
Operating profi t/(loss) (EBIT) 317,6<strong>09</strong> 10,526 (6,410) (234) 3,523 325,014<br />
Financial expenses, net (184)<br />
Share of loss in associates/joint ventures (1,599) (445) (31) (2,075)<br />
Income before taxes 322,755<br />
Income taxes (38,645)<br />
Income after taxes 284,110<br />
Total assets 1,561,089 651,849 111,195 1,137 (898,710) 1,426,560<br />
thereof: Investments in associates/joint ventures 30,386 5,449 8 35,843<br />
Total liabilities 372,938 443,424 116,004 1,687 (534,116) 399,937<br />
Capital expenditure in tangible and<br />
intangible assets<br />
Depreciation and amortization on<br />
57,513 10,244 10,654 52 78,463<br />
tangible and intangible assets 24,600 11,872 4,263 17 40,752<br />
Share-based payments 12,358 2,614 863 2 15,837<br />
Third party sales based on location of customers 518,062 606,755 117,630 6,750 1,249,197<br />
Growth in local currencies 6.9 % 12.9 % 18.4 % 10.3 % 10.8 %<br />
1) “Corporate/Eliminations” includes unallocated corporate assets and liabilities as well as intersegment eliminations.<br />
The Group is active in one business segment; the design, development, manufacture, distribution and<br />
service of hearing systems and related products.<br />
The primary segment information is presented according to geographical regions based on location of<br />
assets. This is in line with the management structure of the Group. Transactions between segments are<br />
generally conducted at arms-length.<br />
Total