Measurement of the Z boson cross-section in - Harvard University ...
Measurement of the Z boson cross-section in - Harvard University ...
Measurement of the Z boson cross-section in - Harvard University ...

You also want an ePaper? Increase the reach of your titles
YUMPU automatically turns print PDFs into web optimized ePapers that Google loves.
Chapter 6: Event Selection 197<br />
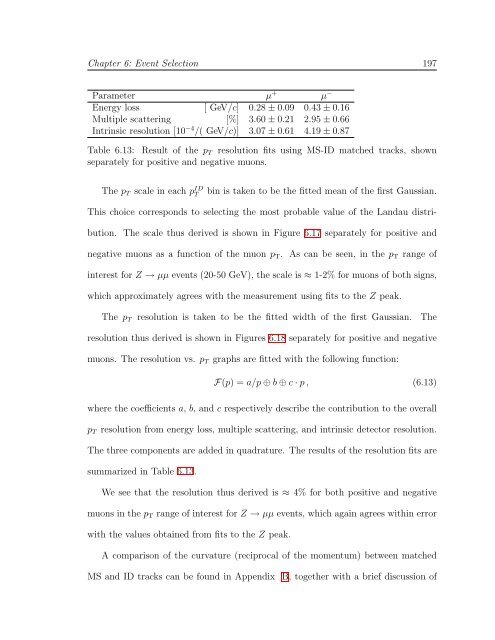
Parameter µ + µ −<br />
Energy loss [ GeV/c] 0.28 ± 0.09 0.43 ± 0.16<br />
Multiple scatter<strong>in</strong>g [%] 3.60 ± 0.21 2.95 ± 0.66<br />
Intr<strong>in</strong>sic resolution [10 −4 /( GeV/c)] 3.07 ± 0.61 4.19 ± 0.87<br />
Table 6.13: Result <strong>of</strong> <strong>the</strong> pT resolution fits us<strong>in</strong>g MS-ID matched tracks, shown<br />
separately for positive and negative muons.<br />
The pT scale <strong>in</strong> each p ID<br />
T b<strong>in</strong> is taken to be <strong>the</strong> fitted mean <strong>of</strong> <strong>the</strong> first Gaussian.<br />
This choice corresponds to select<strong>in</strong>g <strong>the</strong> most probable value <strong>of</strong> <strong>the</strong> Landau distri-<br />
bution. The scale thus derived is shown <strong>in</strong> Figure 6.17 separately for positive and<br />
negative muons as a function <strong>of</strong> <strong>the</strong> muon pT. As can be seen, <strong>in</strong> <strong>the</strong> pT range <strong>of</strong><br />
<strong>in</strong>terest for Z → µµ events (20-50 GeV), <strong>the</strong> scale is ≈ 1-2% for muons <strong>of</strong> both signs,<br />
which approximately agrees with <strong>the</strong> measurement us<strong>in</strong>g fits to <strong>the</strong> Z peak.<br />
The pT resolution is taken to be <strong>the</strong> fitted width <strong>of</strong> <strong>the</strong> first Gaussian. The<br />
resolution thus derived is shown <strong>in</strong> Figures 6.18 separately for positive and negative<br />
muons. The resolution vs. pT graphs are fitted with <strong>the</strong> follow<strong>in</strong>g function:<br />
F(p) =a/p ⊕ b ⊕ c · p, (6.13)<br />
where <strong>the</strong> coefficients a, b, and c respectively describe <strong>the</strong> contribution to <strong>the</strong> overall<br />
pT resolution from energy loss, multiple scatter<strong>in</strong>g, and <strong>in</strong>tr<strong>in</strong>sic detector resolution.<br />
The three components are added <strong>in</strong> quadrature. The results <strong>of</strong> <strong>the</strong> resolution fits are<br />
summarized <strong>in</strong> Table 6.13.<br />
We see that <strong>the</strong> resolution thus derived is ≈ 4% for both positive and negative<br />
muons <strong>in</strong> <strong>the</strong> pT range <strong>of</strong> <strong>in</strong>terest for Z → µµ events, which aga<strong>in</strong> agrees with<strong>in</strong> error<br />
with <strong>the</strong> values obta<strong>in</strong>ed from fits to <strong>the</strong> Z peak.<br />
A comparison <strong>of</strong> <strong>the</strong> curvature (reciprocal <strong>of</strong> <strong>the</strong> momentum) between matched<br />
MS and ID tracks can be found <strong>in</strong> Appendix B, toge<strong>the</strong>r with a brief discussion <strong>of</strong>