- Page 1:
Measurement of the Z boson cross-se
- Page 4 and 5:
Contents Title Page . . . . . . . .
- Page 6 and 7:
Contents vi Electron reconstruction
- Page 8 and 9:
List of Figures 1.1 Proton structur
- Page 10 and 11:
List of Figures x 6.17 Muon pT scal
- Page 12 and 13:
List of Tables xii 6.18 Decompositi
- Page 14 and 15:
Acknowledgments xiv mate Niels van
- Page 16 and 17:
Chapter 1: Introduction and Theoret
- Page 18 and 19:
Chapter 1: Introduction and Theoret
- Page 20 and 21:
Chapter 1: Introduction and Theoret
- Page 22 and 23:
Chapter 1: Introduction and Theoret
- Page 24:
Chapter 1: Introduction and Theoret
- Page 28 and 29:
Chapter 1: Introduction and Theoret
- Page 30 and 31:
Chapter 1: Introduction and Theoret
- Page 32 and 33:
Chapter 1: Introduction and Theoret
- Page 34 and 35:
Chapter 1: Introduction and Theoret
- Page 36 and 37:
Chapter 1: Introduction and Theoret
- Page 38 and 39:
Chapter 1: Introduction and Theoret
- Page 40 and 41:
Chapter 1: Introduction and Theoret
- Page 42 and 43:
Chapter 1: Introduction and Theoret
- Page 44 and 45:
Chapter 1: Introduction and Theoret
- Page 46 and 47:
Chapter 1: Introduction and Theoret
- Page 48 and 49:
Chapter 2 The Accelerator and the E
- Page 50:
Chapter 2: The Accelerator and the
- Page 53 and 54:
Chapter 2: The Accelerator and the
- Page 55 and 56:
Chapter 2: The Accelerator and the
- Page 57:
Chapter 2: The Accelerator and the
- Page 60 and 61:
Chapter 2: The Accelerator and the
- Page 63:
Chapter 2: The Accelerator and the
- Page 66 and 67:
Chapter 2: The Accelerator and the
- Page 68 and 69:
Chapter 2: The Accelerator and the
- Page 70 and 71:
Chapter 2: The Accelerator and the
- Page 72 and 73:
Chapter 2: The Accelerator and the
- Page 74 and 75:
Chapter 2: The Accelerator and the
- Page 76 and 77:
Chapter 2: The Accelerator and the
- Page 78 and 79:
Chapter 2: The Accelerator and the
- Page 80:
Chapter 3 Luminosity Measurement at
- Page 87 and 88:
Chapter 3: Luminosity Measurement a
- Page 89 and 90:
Chapter 3: Luminosity Measurement a
- Page 91 and 92:
Chapter 3: Luminosity Measurement a
- Page 93 and 94:
Chapter 3: Luminosity Measurement a
- Page 95 and 96:
Chapter 3: Luminosity Measurement a
- Page 97 and 98:
Chapter 3: Luminosity Measurement a
- Page 99 and 100:
Chapter 3: Luminosity Measurement a
- Page 101 and 102:
Chapter 3: Luminosity Measurement a
- Page 103 and 104:
Chapter 3: Luminosity Measurement a
- Page 105 and 106:
Chapter 3: Luminosity Measurement a
- Page 107 and 108:
Chapter 3: Luminosity Measurement a
- Page 109 and 110:
Chapter 4: Data Collection and Even
- Page 111 and 112:
Chapter 4: Data Collection and Even
- Page 113 and 114:
Chapter 4: Data Collection and Even
- Page 115 and 116:
Chapter 4: Data Collection and Even
- Page 117 and 118:
Chapter 4: Data Collection and Even
- Page 119 and 120:
Chapter 4: Data Collection and Even
- Page 121 and 122:
Chapter 4: Data Collection and Even
- Page 123 and 124:
Chapter 4: Data Collection and Even
- Page 125 and 126:
Chapter 4: Data Collection and Even
- Page 127 and 128:
Chapter 4: Data Collection and Even
- Page 129 and 130:
Chapter 4: Data Collection and Even
- Page 131 and 132:
Chapter 4: Data Collection and Even
- Page 133 and 134:
Chapter 4: Data Collection and Even
- Page 135:
Chapter 4: Data Collection and Even
- Page 140:
Chapter 4: Data Collection and Even
- Page 143 and 144:
Chapter 4: Data Collection and Even
- Page 145 and 146:
Chapter 4: Data Collection and Even
- Page 147 and 148:
Chapter 4: Data Collection and Even
- Page 149 and 150:
Chapter 4: Data Collection and Even
- Page 151 and 152:
Chapter 4: Data Collection and Even
- Page 153 and 154:
Chapter 4: Data Collection and Even
- Page 155 and 156:
Chapter 4: Data Collection and Even
- Page 157:
Chapter 4: Data Collection and Even
- Page 160 and 161:
Chapter 4: Data Collection and Even
- Page 162: Chapter 4: Data Collection and Even
- Page 165 and 166: Chapter 4: Data Collection and Even
- Page 167 and 168: Chapter 5: Monte Carlo Simulation 1
- Page 169 and 170: Chapter 5: Monte Carlo Simulation 1
- Page 171: Chapter 5: Monte Carlo Simulation 1
- Page 174 and 175: Chapter 6 Event Selection After eve
- Page 177 and 178: Chapter 6: Event Selection 163 - In
- Page 179 and 180: Chapter 6: Event Selection 165 Figu
- Page 181 and 182: Chapter 6: Event Selection 167 with
- Page 183 and 184: Chapter 6: Event Selection 169 Entr
- Page 185 and 186: Chapter 6: Event Selection 171 Entr
- Page 187 and 188: Chapter 6: Event Selection 173 T p
- Page 189 and 190: Chapter 6: Event Selection 175 Figu
- Page 191: Chapter 6: Event Selection 177 6.2.
- Page 197 and 198: Chapter 6: Event Selection 183 Figu
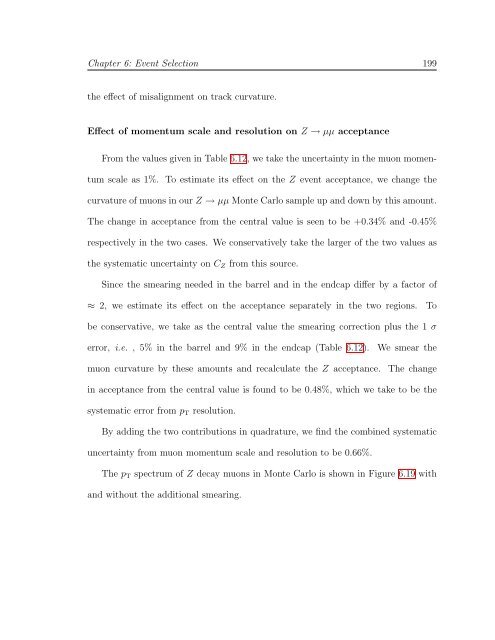
- Page 199: Chapter 6: Event Selection 185 are
- Page 203 and 204: Chapter 6: Event Selection 189 Reco
- Page 205 and 206: Chapter 6: Event Selection 191 smea
- Page 207 and 208: Chapter 6: Event Selection 193 Firs
- Page 211: Chapter 6: Event Selection 197 Para
- Page 217: Chapter 6: Event Selection 203 Para
- Page 222 and 223: Chapter 7: Background Estimation 20
- Page 224 and 225: Chapter 7: Background Estimation 21
- Page 226 and 227: Chapter 7: Background Estimation 21
- Page 228 and 229: Chapter 7: Background Estimation 21
- Page 230 and 231: Chapter 7: Background Estimation 21
- Page 232 and 233: Chapter 7: Background Estimation 21
- Page 234 and 235: Chapter 7: Background Estimation 22
- Page 236 and 237: Chapter 7: Background Estimation 22
- Page 238 and 239: Chapter 8: Properties of Z bosons a
- Page 240 and 241: Chapter 8: Properties of Z bosons a
- Page 242 and 243: Chapter 8: Properties of Z bosons a
- Page 244 and 245: Chapter 8: Properties of Z bosons a
- Page 246 and 247: Chapter 8: Properties of Z bosons a
- Page 248: Chapter 8: Properties of Z bosons a
- Page 253 and 254: Chapter 9: Discussion and Outlook 2
- Page 255 and 256: Chapter 9: Discussion and Outlook 2
- Page 257 and 258: Chapter 9: Discussion and Outlook 2
- Page 259 and 260: Appendix A: Event list 245 Candidat
- Page 261 and 262: Appendix A: Event list 247 Candidat
- Page 263 and 264:
Appendix B: Comparison of muon curv
- Page 265 and 266:
Bibliography 251 [13] S. Ask. Statu
- Page 267 and 268:
Bibliography 253 [44] S. Frixione,
- Page 269 and 270:
Bibliography 255 [75] N. E. Adam an
- Page 271:
Bibliography 257 [102] The TOTEM Co