- Page 1 and 2:
Transcriptional Characterization of
- Page 3 and 4:
This dissertation is my own work an
- Page 5 and 6:
Acknowledgements I would like to th
- Page 7 and 8:
5.9 External Dataset Expression Cor
- Page 9 and 10:
Introduction 1
- Page 11 and 12:
1.1 Glial Cells in the Central Nerv
- Page 13 and 14:
1.2 Glioblastoma Multiforme Introdu
- Page 15 and 16:
1.2 Glioblastoma Multiforme Introdu
- Page 17 and 18:
1.2 Glioblastoma Multiforme Introdu
- Page 19 and 20:
1.3 Primary and Secondary Glioblast
- Page 21 and 22:
1.3 Primary and Secondary Glioblast
- Page 23 and 24:
1.3 Primary and Secondary Glioblast
- Page 25 and 26:
1.3 Primary and Secondary Glioblast
- Page 27 and 28:
1.3 Primary and Secondary Glioblast
- Page 29 and 30:
1.4 Pathways Involved in Glioblasto
- Page 31 and 32:
1.4 Pathways Involved in Glioblasto
- Page 33 and 34:
1.4 Pathways Involved in Glioblasto
- Page 35 and 36:
1.4 Pathways Involved in Glioblasto
- Page 37 and 38:
1.4 Pathways Involved in Glioblasto
- Page 39 and 40:
1.5 Pathway Crosstalk Introduction
- Page 41 and 42:
Chapter 2 Neurogenesis Contents 2.1
- Page 43 and 44:
2.1 Radial Glia Introduction VZ adj
- Page 45 and 46:
2.2 Neural Stem Cells Introduction
- Page 47 and 48:
2.2 Neural Stem Cells Introduction
- Page 49 and 50:
2.2 Neural Stem Cells Introduction
- Page 51 and 52:
2.2 Neural Stem Cells Introduction
- Page 53 and 54:
2.2 Neural Stem Cells Introduction
- Page 55 and 56:
2.2 Neural Stem Cells Introduction
- Page 57 and 58:
2.2 Neural Stem Cells Introduction
- Page 59 and 60:
2.2 Neural Stem Cells Introduction
- Page 61 and 62:
2.2 Neural Stem Cells Introduction
- Page 63 and 64:
2.2 Neural Stem Cells Introduction
- Page 65 and 66:
Chapter 3 Brain Cancer Stem Cells C
- Page 67 and 68:
3.1 The Cancer Stem Cell Hypothesis
- Page 69 and 70:
3.1 The Cancer Stem Cell Hypothesis
- Page 71 and 72:
3.2 Brain Cancer Stem Cells Introdu
- Page 73 and 74:
3.2 Brain Cancer Stem Cells Introdu
- Page 75 and 76:
3.2 Brain Cancer Stem Cells Introdu
- Page 77 and 78:
3.2 Brain Cancer Stem Cells Introdu
- Page 79 and 80:
3.2 Brain Cancer Stem Cells Introdu
- Page 81 and 82:
3.3 Glioma Culture Systems Introduc
- Page 83 and 84:
3.3 Glioma Culture Systems Introduc
- Page 85 and 86:
3.3 Glioma Culture Systems Introduc
- Page 87 and 88:
3.3 Glioma Culture Systems Introduc
- Page 89 and 90:
3.3 Glioma Culture Systems Introduc
- Page 91 and 92:
3.3 Glioma Culture Systems Introduc
- Page 93 and 94:
Chapter 4 The Non-Coding RNA World
- Page 95 and 96: 4.1 MicroRNA regulation Introductio
- Page 97 and 98: 4.1 MicroRNA regulation Introductio
- Page 99 and 100: 4.2 Target Prediction and Validatio
- Page 101 and 102: Methods 93
- Page 103 and 104: 5.1 Tag-sequencing Data Processing
- Page 105 and 106: 5.1 Tag-sequencing Data Processing
- Page 107 and 108: 5.2 Array Comparative Genomic Hybri
- Page 109 and 110: 5.4 Quantitative Real Time-PCR Vali
- Page 111 and 112: 5.4 Quantitative Real Time-PCR Vali
- Page 113 and 114: 5.4 Quantitative Real Time-PCR Vali
- Page 115 and 116: 5.5 Literature Mining Methods Figur
- Page 117 and 118: 5.5 Literature Mining Methods How m
- Page 119 and 120: 5.6 Differential Isoform Expression
- Page 121 and 122: 5.9 External Dataset Expression Cor
- Page 123 and 124: 5.10 Glioblastoma Pathway Construct
- Page 125 and 126: 5.11 MicroRNA Target Prediction Ana
- Page 127 and 128: Results 119
- Page 129 and 130: 6.2 Tag mapping Results Table 6.1:
- Page 131 and 132: 6.2 Tag mapping Results 123 Figure
- Page 133 and 134: 6.3 Copy Number Aberrations Results
- Page 135 and 136: 6.3 Copy Number Aberrations Results
- Page 137 and 138: 6.4 Core Differentially Expressed G
- Page 139 and 140: 6.4 Core Differentially Expressed G
- Page 141 and 142: 6.4 Core Differentially Expressed G
- Page 143 and 144: 6.4 Core Differentially Expressed G
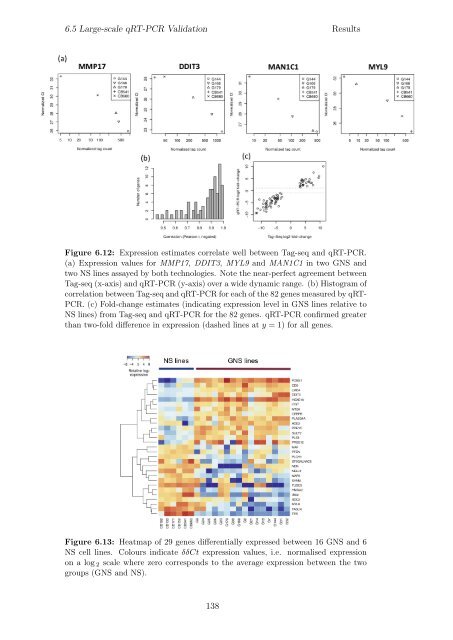
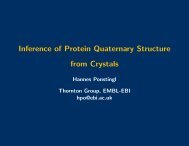
- Page 145: 6.5 Large-scale qRT-PCR Validation
- Page 149 and 150: 6.5 Large-scale qRT-PCR Validation
- Page 151 and 152: 6.6 Literature Mining for Different
- Page 153 and 154: 6.7 Isoform Differential Expression
- Page 155 and 156: 6.7 Isoform Differential Expression
- Page 157 and 158: 6.7 Isoform Differential Expression
- Page 159 and 160: 6.7 Isoform Differential Expression
- Page 161 and 162: 6.7 Isoform Differential Expression
- Page 163 and 164: 6.7 Isoform Differential Expression
- Page 165 and 166: 6.8 Long ncRNA Differential Express
- Page 167 and 168: 6.8 Long ncRNA Differential Express
- Page 169 and 170: Chapter 7 Dataset Correlation Analy
- Page 171 and 172: 7.1 Enrichment Analysis Results Tab
- Page 173 and 174: 7.1 Enrichment Analysis Results Fig
- Page 175 and 176: 7.1 Enrichment Analysis Results Tab
- Page 177 and 178: 7.2 Glioblastoma Expression Signatu
- Page 179 and 180: 7.3 Tumour Expression Correlation R
- Page 181 and 182: 7.3 Tumour Expression Correlation R
- Page 183 and 184: 7.3 Tumour Expression Correlation R
- Page 185 and 186: 7.3 Tumour Expression Correlation R
- Page 187 and 188: 7.3 Tumour Expression Correlation R
- Page 189 and 190: 7.3 Tumour Expression Correlation R
- Page 191 and 192: 7.4 Survival Analysis Results Table
- Page 193 and 194: 7.4 Survival Analysis Results 867 g
- Page 195 and 196: 7.5 Glioblastoma Pathway Analysis R
- Page 197 and 198:
7.5 Glioblastoma Pathway Analysis R
- Page 199 and 200:
7.5 Glioblastoma Pathway Analysis R
- Page 201 and 202:
7.5 Glioblastoma Pathway Analysis R
- Page 203 and 204:
7.5 Glioblastoma Pathway Analysis R
- Page 205 and 206:
7.5 Glioblastoma Pathway Analysis R
- Page 207 and 208:
7.5 Glioblastoma Pathway Analysis R
- Page 209 and 210:
7.5 Glioblastoma Pathway Analysis R
- Page 211 and 212:
8.1 Principles Results say, this is
- Page 213 and 214:
8.3 Databases Results Figure 8.1: O
- Page 215 and 216:
8.3 Databases Results Figure 8.3: W
- Page 217 and 218:
8.4 Filters Results Bayesian method
- Page 219 and 220:
8.5 Target Prediction Ensemble Anal
- Page 221 and 222:
8.5 Target Prediction Ensemble Anal
- Page 223 and 224:
8.5 Target Prediction Ensemble Anal
- Page 225 and 226:
8.5 Target Prediction Ensemble Anal
- Page 227 and 228:
8.5 Target Prediction Ensemble Anal
- Page 229 and 230:
9.1. Digital Profiling of GNS Cell
- Page 231 and 232:
9.1. Digital Profiling of GNS Cell
- Page 233 and 234:
9.1. Digital Profiling of GNS Cell
- Page 235 and 236:
9.1. Digital Profiling of GNS Cell
- Page 237 and 238:
9.1. Digital Profiling of GNS Cell
- Page 239 and 240:
9.2. MicroRNA Target Prediction Ana
- Page 241 and 242:
9.3. Concluding Remarks Appendix pr
- Page 243 and 244:
A.1 Differential Expression Appendi
- Page 245 and 246:
A.1 Differential Expression Appendi
- Page 247 and 248:
A.1 Differential Expression Appendi
- Page 249 and 250:
A.1 Differential Expression Appendi
- Page 251 and 252:
A.1 Differential Expression Appendi
- Page 253 and 254:
A.1 Differential Expression Appendi
- Page 255 and 256:
A.1 Differential Expression Appendi
- Page 257 and 258:
A.1 Differential Expression Appendi
- Page 259 and 260:
A.2 Classified Differential Express
- Page 261 and 262:
A.2 Classified Differential Express
- Page 263 and 264:
A.2 Classified Differential Express
- Page 265 and 266:
A.3 Quantitative RT-PCR Appendix Ta
- Page 267 and 268:
A.3 Quantitative RT-PCR Appendix We
- Page 269 and 270:
A.3 Quantitative RT-PCR Appendix Ta
- Page 271 and 272:
A.3 Quantitative RT-PCR Appendix We
- Page 273 and 274:
A.4 Tag-seq vs qRT-PCR Correlation
- Page 275 and 276:
Appendix "BEX5", "DIAPH2", "GBP3",
- Page 277 and 278:
End Select End If End Sub Appendix
- Page 279 and 280:
If NameStr.ToLower().Equals("query"
- Page 281 and 282:
Appendix C Long ncRNAs We detected
- Page 283 and 284:
C. Long ncRNAs Appendix Tag Accessi
- Page 285 and 286:
D.1 Pathway Interactions Appendix F
- Page 287 and 288:
D.1 Pathway Interactions Appendix F
- Page 289 and 290:
D.1 Pathway Interactions Appendix F
- Page 291 and 292:
D.2 Pathway Images Appendix Figure
- Page 293 and 294:
D.2 Pathway Images Appendix Figure
- Page 295 and 296:
E. Exon Array Data Appendix Average
- Page 297 and 298:
E. Exon Array Data Appendix Average
- Page 299 and 300:
E. Exon Array Data Appendix Average
- Page 301 and 302:
E. Exon Array Data Appendix Average
- Page 303 and 304:
E. Exon Array Data Appendix Average
- Page 305 and 306:
E. Exon Array Data Appendix Average
- Page 307 and 308:
E. Exon Array Data Appendix Average
- Page 309 and 310:
F. MicroRNA Array Data Appendix Tab
- Page 311 and 312:
F. MicroRNA Array Data Appendix GNS
- Page 313 and 314:
F. MicroRNA Array Data Appendix GNS
- Page 315 and 316:
Ln Natural logarithm LOH Loss of He
- Page 317 and 318:
3.3 Schematisation of cell cycle ph
- Page 319 and 320:
8.3 Workflows at the core of the pr
- Page 321 and 322:
7.1 Selected Gene Ontology terms an
- Page 323 and 324:
Bibliography [1] Cell signaling tec
- Page 325 and 326:
[38] G. Bain, D. Kitchens, M. Yao,
- Page 327 and 328:
[78] S. Bustin, V. Benes, J. Garson
- Page 329 and 330:
[112] M. Czystowska, J. Han, M. Szc
- Page 331 and 332:
[153] T. Fujiwara, M. Bandi, M. Nit
- Page 333 and 334:
[192] M. Hernandez, M. Nieto, and M
- Page 335 and 336:
[231] T.-M. Kim, W. Huang, R. Park,
- Page 337 and 338:
[268] H. Lemjabbar-Alaoui, A. van Z
- Page 339 and 340:
[305] K. MAEDA, S. MATSUHASHI, K. T
- Page 341 and 342:
[342] H. Moon, M. Ahn, J. Park, K.
- Page 343 and 344:
[379] D. Park and J. Rich. Biology
- Page 345 and 346:
[417] P. Rakic. Guidance of neurons
- Page 347 and 348:
[456] T. Shima, N. Okumura, T. Taka
- Page 349 and 350:
[490] P. A. C. t’Hoen, Y. Ariyure
- Page 351 and 352:
[523] T. Watanabe, A. Takeda, T. Ts