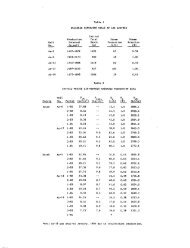
Figure I Generalized map of the Wilbur Mining ... - University of Utah
Figure I Generalized map of the Wilbur Mining ... - University of Utah
Figure I Generalized map of the Wilbur Mining ... - University of Utah

Create successful ePaper yourself
Turn your PDF publications into a flip-book with our unique Google optimized e-Paper software.
Geo<strong>the</strong>rmal Resources Council, TRANSACTIONS, Vol. 3 Septetrher 1979<br />
THE INFLUENCE OF STEAM-WATER RELATIVE PERMEABILITY CURVES ON<br />
THE NUMERICAL MODELING RESULTS OF LIQUID DOMINATED GEOTHERMAL RESERVOIRS<br />
ABSTRACT<br />
Sensitivity analyses for modeling <strong>of</strong> a hypo<strong>the</strong>tical<br />
liquid dominated geo<strong>the</strong>rmal reservoir<br />
indicate <strong>the</strong> strong dependence <strong>of</strong> <strong>the</strong> results on<br />
<strong>the</strong> assumptions made about <strong>the</strong> steam-water<br />
relative permeability curves. Of significant<br />
importance are <strong>the</strong> critical saturation points for<br />
<strong>the</strong> individual phases and <strong>the</strong> curvature <strong>of</strong> plots.<br />
The effects are more evident on calculated<br />
producing wellbore pressure and projected heat<br />
recovery.<br />
INTRODUCTION<br />
The success <strong>of</strong> numerical modeling for hydro<strong>the</strong>rmal<br />
systems depends on <strong>the</strong> assumptions raade<br />
about <strong>the</strong> rock and fluid property data. One piece<br />
<strong>of</strong> information that strongly controls <strong>the</strong> results<br />
<strong>of</strong> model studies for two phase flow in reservoirs<br />
is <strong>the</strong> assumed values for relative permeabilities.<br />
A review <strong>of</strong> literature shows that in previously<br />
published model studies on geo<strong>the</strong>rmal<br />
systems, <strong>the</strong> concept <strong>of</strong> relative permeability has<br />
been treated lightly, perhaps because <strong>of</strong> lack <strong>of</strong><br />
information. Relative permeabilities used in <strong>the</strong><br />
past include systems similar to oil-water models<br />
as used by Martin', or approximations by simple<br />
models such as Corey's^ as used by Faust and<br />
Mercer,^ Jonsson'' from his modeling work<br />
indicated that relative permeability data had<br />
little influence on pressure drop and saturation<br />
d istr i but ion.<br />
Recently, evidence <strong>of</strong> actual lab derived<br />
relative permeability curves for steam-water<br />
systems has appeared in <strong>the</strong> literature.^ * These<br />
curves show that <strong>the</strong> end points, corresponding to<br />
<strong>the</strong> critical water and critical steam saturation,<br />
may be much different than <strong>the</strong> ones used in oilwater<br />
or water-gas system.<br />
In this study an effort was made'to look at<br />
<strong>the</strong> sensitivity <strong>of</strong> numerical modeling results to<br />
<strong>the</strong> assumed values <strong>of</strong> relative permeability data.<br />
DESCRIPTION OF THE MODEL<br />
The numerical model used in this study was a<br />
modified version <strong>of</strong> a program originally developed<br />
by Faust and Mercer. Relative permeability curves<br />
H. Sun and I. Ershaghi<br />
<strong>University</strong> <strong>of</strong> Sou<strong>the</strong>rn California<br />
697<br />
were furnished to <strong>the</strong> program through <strong>the</strong> use <strong>of</strong><br />
an equation which allowed for selection <strong>of</strong> a<br />
wide range <strong>of</strong> end points as well as curvatures.<br />
The general form <strong>of</strong> <strong>the</strong> equation may be shown as<br />
follows:<br />
(S - S )<br />
'I<br />
w wc<br />
b (1 S - S )<br />
W SC<br />
where S = water saturation, fraction<br />
w<br />
S = critical water saturation, fraction<br />
WC<br />
S = critical steam saturation, fraction<br />
SC<br />
a, b, n and n are constants.<br />
The model was used for a one dimensional<br />
reservoir initially containing hot water with<br />
one producing well and no recharge. The heat<br />
and mass recovery as a function <strong>of</strong> time were<br />
computed using different sets <strong>of</strong> relative permeabilities.<br />
Table I shows some <strong>of</strong> <strong>the</strong> specifications<br />
used in <strong>the</strong> model.<br />
Throughout <strong>the</strong> life <strong>of</strong> <strong>the</strong> system, flow<br />
toward <strong>the</strong> wellbore occurs in three distinct<br />
periods. The initial period <strong>of</strong> single phase<br />
liquid flow, followed by a two phase liquid-vapor<br />
flow and <strong>the</strong> eventual conversion to one phase<br />
vapor flow. In assessing <strong>the</strong> importance <strong>of</strong><br />
accurate relative permeability data on modeling<br />
. results, one must examine <strong>the</strong> outputs which can<br />
be used for history matching purposes. The study<br />
<strong>of</strong> saturation distribution and o<strong>the</strong>r pr<strong>of</strong>iles in<br />
<strong>the</strong> reservoir as used by Jonsson may be somewhat<br />
mi sleadi ng.<br />
There are several ways to use numerical<br />
modeling results for history matching purposes.<br />
The results <strong>of</strong> this study are presented in terms<br />
<strong>of</strong> heat recovery versus time and wellbore<br />
producing pressure versus time.<br />
The effect <strong>of</strong> assumed values for critical<br />
saturation <strong>of</strong> water is shown in Fig. 1. During<br />
<strong>the</strong> two phase flow, <strong>the</strong> Change <strong>of</strong> critical water<br />
saturation from 0,3 to 0.5 could cause significant<br />
differences in <strong>the</strong> performance projection for<br />
1'<br />
i!<br />
I I<br />
,1