Figure I Generalized map of the Wilbur Mining ... - University of Utah
Figure I Generalized map of the Wilbur Mining ... - University of Utah
Figure I Generalized map of the Wilbur Mining ... - University of Utah

You also want an ePaper? Increase the reach of your titles
YUMPU automatically turns print PDFs into web optimized ePapers that Google loves.
J<br />
0<br />
10<br />
X<br />
a.<br />
^20<br />
30<br />
2") 22<br />
/<br />
,/<br />
\<br />
\<br />
\<br />
38°C/km-J<br />
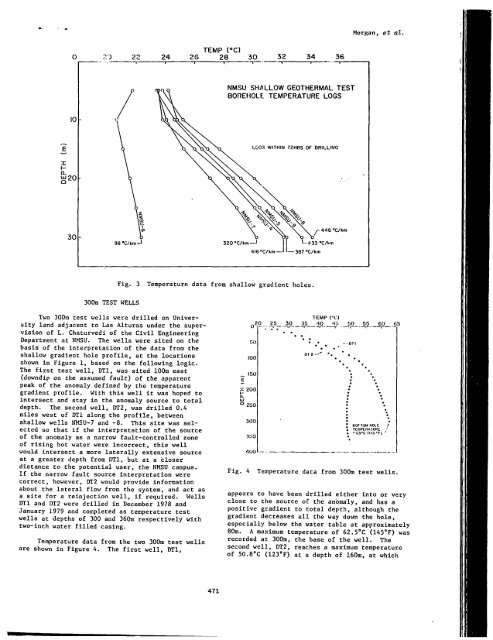
300m TEST WELLS<br />
\ \<br />
\(J1<br />
24<br />
K<br />
Two 300m test wells were drilled on <strong>University</strong><br />
land adjacent to Las Alturas under <strong>the</strong> supervision<br />
<strong>of</strong> L. Chaturvedi <strong>of</strong> <strong>the</strong> Civil Engineering<br />
Department at NMSU. The wells were sited on <strong>the</strong><br />
basis <strong>of</strong> <strong>the</strong> interpretation <strong>of</strong> <strong>the</strong> data from <strong>the</strong><br />
shallow gradient hole pr<strong>of</strong>ile, at <strong>the</strong> locations<br />
shown in <strong>Figure</strong> 1, based on <strong>the</strong> following logic.<br />
The first test well, DTI, was sited 100m east<br />
(downdip on <strong>the</strong> assumed fault) <strong>of</strong> <strong>the</strong> apparent<br />
peak <strong>of</strong> <strong>the</strong> anomaly defined by <strong>the</strong> temperature<br />
gradient pr<strong>of</strong>ile. With this well it was hoped to<br />
intersect and stay in <strong>the</strong> anomaly source to total<br />
depth. The second well, DT2, was drilled 0.4<br />
miles west <strong>of</strong> DTI along <strong>the</strong> pr<strong>of</strong>ile, between<br />
shallow wells HMSU-7 and -8. This site was selected<br />
so that if <strong>the</strong> interpretation <strong>of</strong> <strong>the</strong> source<br />
<strong>of</strong> <strong>the</strong> anomaly as a narrow fault-controlled zone<br />
<strong>of</strong> rising hot water were incorrect, this well<br />
would intersect a more laterally extensive source<br />
at a greater depth from DTI, but at a closer<br />
distance to <strong>the</strong> potential user, <strong>the</strong> NMSU campus.<br />
If <strong>the</strong> narrow fault source interpretation were<br />
correct, however, DT2 would provide information<br />
about <strong>the</strong> lateral flow from <strong>the</strong> system, and act as<br />
a site for a reinjection well, if required. Wells<br />
DTI and DT2 were drilled in December 1978 and<br />
January 1979 and completed as temperature test<br />
wells at depths <strong>of</strong> 300 and 360m respectively with<br />
two-inch water filled casing.<br />
Temperature data from <strong>the</strong> two 300m test wells<br />
are shown in <strong>Figure</strong> 4. The first well, DTI,<br />
TEMP CO<br />
26 28 30 32 34 36<br />
NMSU SH/lLLOW GEOTHERMAL TEST<br />
BOREHOLE TEMPERATURE LOGS<br />
\ , \ ^ ^ 0 \ ^ LOGS WITHIN 72HRS OF DRILLING<br />
\ V ^ ^ ^<br />
\^x<br />
\ " N V ^ V \ /-446°C/km<br />
320°C/krn—1 TT L-4 33 .c/km<br />