Figure I Generalized map of the Wilbur Mining ... - University of Utah
Figure I Generalized map of the Wilbur Mining ... - University of Utah
Figure I Generalized map of the Wilbur Mining ... - University of Utah

Create successful ePaper yourself
Turn your PDF publications into a flip-book with our unique Google optimized e-Paper software.
to test <strong>the</strong> variation <strong>of</strong> water chemistry with<br />
tirae. Tanperature measurements and water samples<br />
collected at each sampling site were taken as<br />
close to <strong>the</strong> source as possible and at <strong>the</strong> same<br />
location throughout <strong>the</strong> sampling period. Temperatures<br />
were measured with an Extech 1200 digital<br />
<strong>the</strong>rmometer. The pH was determined in <strong>the</strong><br />
field on an unfiltered sample with a Photovolt pH<br />
meter 126A.<br />
Water samples collected for chanical analysis<br />
were analyzed for Si02, Na"*", K^, Ca"*^, Mg"''^, and<br />
Li'*' on a Varian 1250 Atomic Absorption. Spectrophotometer.<br />
F~, Cl", and SO^^ were analyzed on a<br />
Dionex 10 Ion Chromatograph. Total dissolved<br />
solids were deteraiined on filtered uncreated samples<br />
by <strong>the</strong> residue-on-evaporation method (Rainwater<br />
and Thatcher, 1960).<br />
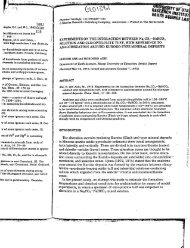
GEOCHEMISTRY OF THERMAL AND NON-THERMAL WATERS<br />
The <strong>the</strong>rmal waters (Group I) are a sodiumchloride-sulfate<br />
type. .The waters have relatively<br />
high concentrations <strong>of</strong> Si02, Li"*", and F" and<br />
Satkln et al.<br />
low Mg (Table I). In contrast, <strong>the</strong> non-<strong>the</strong>rmal<br />
waters (Group II) are enriched in Ca"*"*", and Mg"*^<br />
and have lower concentrations <strong>of</strong> SiOo, Li"*", and<br />
Within <strong>the</strong> non-<strong>the</strong>rmal group <strong>of</strong> waters a subgroup<br />
<strong>of</strong> waters (Group III) can be distinguished<br />
by <strong>the</strong>ir high salinity. Both Casa Rosa and Dripping<br />
Springs are highly enriched in Na"*", Ca'*^, Li'*;<br />
C1-, and S0/;°. It is possible that <strong>the</strong>se waters<br />
follow a different hydrologic flow pattern. They<br />
may derive <strong>the</strong>ir high salinity from, dissolution<br />
<strong>of</strong> limestones and evaporites that crop out 20 km<br />
to <strong>the</strong> west. A heavy isotopic signature may confirm<br />
this suggestion.<br />
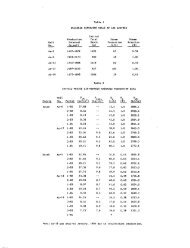
The measured surface temperature at Castle<br />
Hot Springs ranges between 47.6°C and 55.4''C with<br />
a flow rate <strong>of</strong> 1300 l/min (340 gal/min). The<br />
springs were sampled periodically (3-4 week intervals)<br />
to test <strong>the</strong> variation <strong>of</strong> chemistry with<br />
time. It is evident from <strong>the</strong> chemical analyses<br />
listed in Table II that <strong>the</strong>re has been no significant<br />
change in <strong>the</strong> main spring systan's chemistry.<br />
Table 2, Chemical variation through time at Castle Hot Springs, Arizona. Analyses in ppm (mg/l).<br />
Date<br />
Temp. °C<br />
pH<br />
K<br />
C^tt Mg^<br />
Li^<br />
F<br />
Cl"<br />
'%<br />
400T<br />
"§ 300<br />
a<br />
o.<br />
200<br />
lOO<br />
0<br />
10/9/79<br />
51.3<br />
7.60<br />
59.70<br />
209.08<br />
4.98<br />
30.33<br />
2.36<br />
n.d.<br />
8.50<br />
147<br />
212<br />
10/24/79<br />
55.4<br />
7.65<br />
63.48<br />
208.75<br />
5.49<br />
34.04<br />
2.99<br />
n.d.<br />
9.16<br />
155<br />
230<br />
Note: n.d. - not deterrained<br />
o o<br />
m<br />
Ca"*^ (ppm)<br />
11/27/79<br />
54,7<br />
7.85<br />
61.27<br />
208.03<br />
5.42<br />
32,42<br />
2.32<br />
0.34<br />
8.45<br />
145<br />
211<br />
Group III<br />
Group II<br />
<strong>Figure</strong> 2. Water chemistry Ca"*"^ versus SO^.<br />
o<br />
12/20/79<br />
52.7<br />
7.75<br />
60.27<br />
210.89<br />
5.50<br />
31.89<br />
2.63<br />
0.33<br />
8.70<br />
141<br />
211<br />
179<br />
1/9/80<br />
53.4<br />
7.70<br />
58.68<br />
195.27<br />
5.55<br />
29.46<br />
2.37<br />
0.32<br />
8.53<br />
140<br />
206<br />
1.2T<br />
0.9<br />
0.6<br />
0.3<br />
»<br />
2/3/80<br />
52.1<br />
7.85<br />
59.37<br />
199.64<br />
5.35<br />
29.78<br />
2.32<br />
0.31<br />
8.61<br />
141<br />
200<br />
3/7/80<br />
49.3<br />
7.80<br />
61.79<br />
202.12<br />
5.61<br />
29.52<br />
2.41<br />
0.31<br />
8,47<br />
138<br />
196<br />
Group I<br />
Croup II<br />
4/10/80<br />
47.6<br />
7.85<br />
62.01<br />
221.56<br />
5.39<br />
31.07<br />
2.43<br />
0.30<br />
8.31<br />
140<br />
189<br />
Group III<br />
o<br />
o<br />
Cl" (ppm)<br />
<strong>Figure</strong> 3. Water chemistry Cl" versus Li<br />
5/12/80<br />
47.7<br />
7.85<br />
62.25<br />
202.93<br />
5.54<br />
31.46<br />
2.50<br />
0.32<br />
8.64<br />
143<br />
206<br />
o